Datadog
Datadog is an analytics tool that can be used for event monitoring, log collection, and much more. As you scale your Terraform and OpenTofu usage, the ability to analyze the audit logs, run results, run execution time, and any other aspect of Terraform operations becomes extremely important to optimize your overall Terraform workflow.
Events
The Datadog integration can currently stream event details for Terraform and OpenTofu runs executed in Scalr. To integrate with Datadog, simply go to the integrations page at the account scope, select Datadog, and add the necessary information:
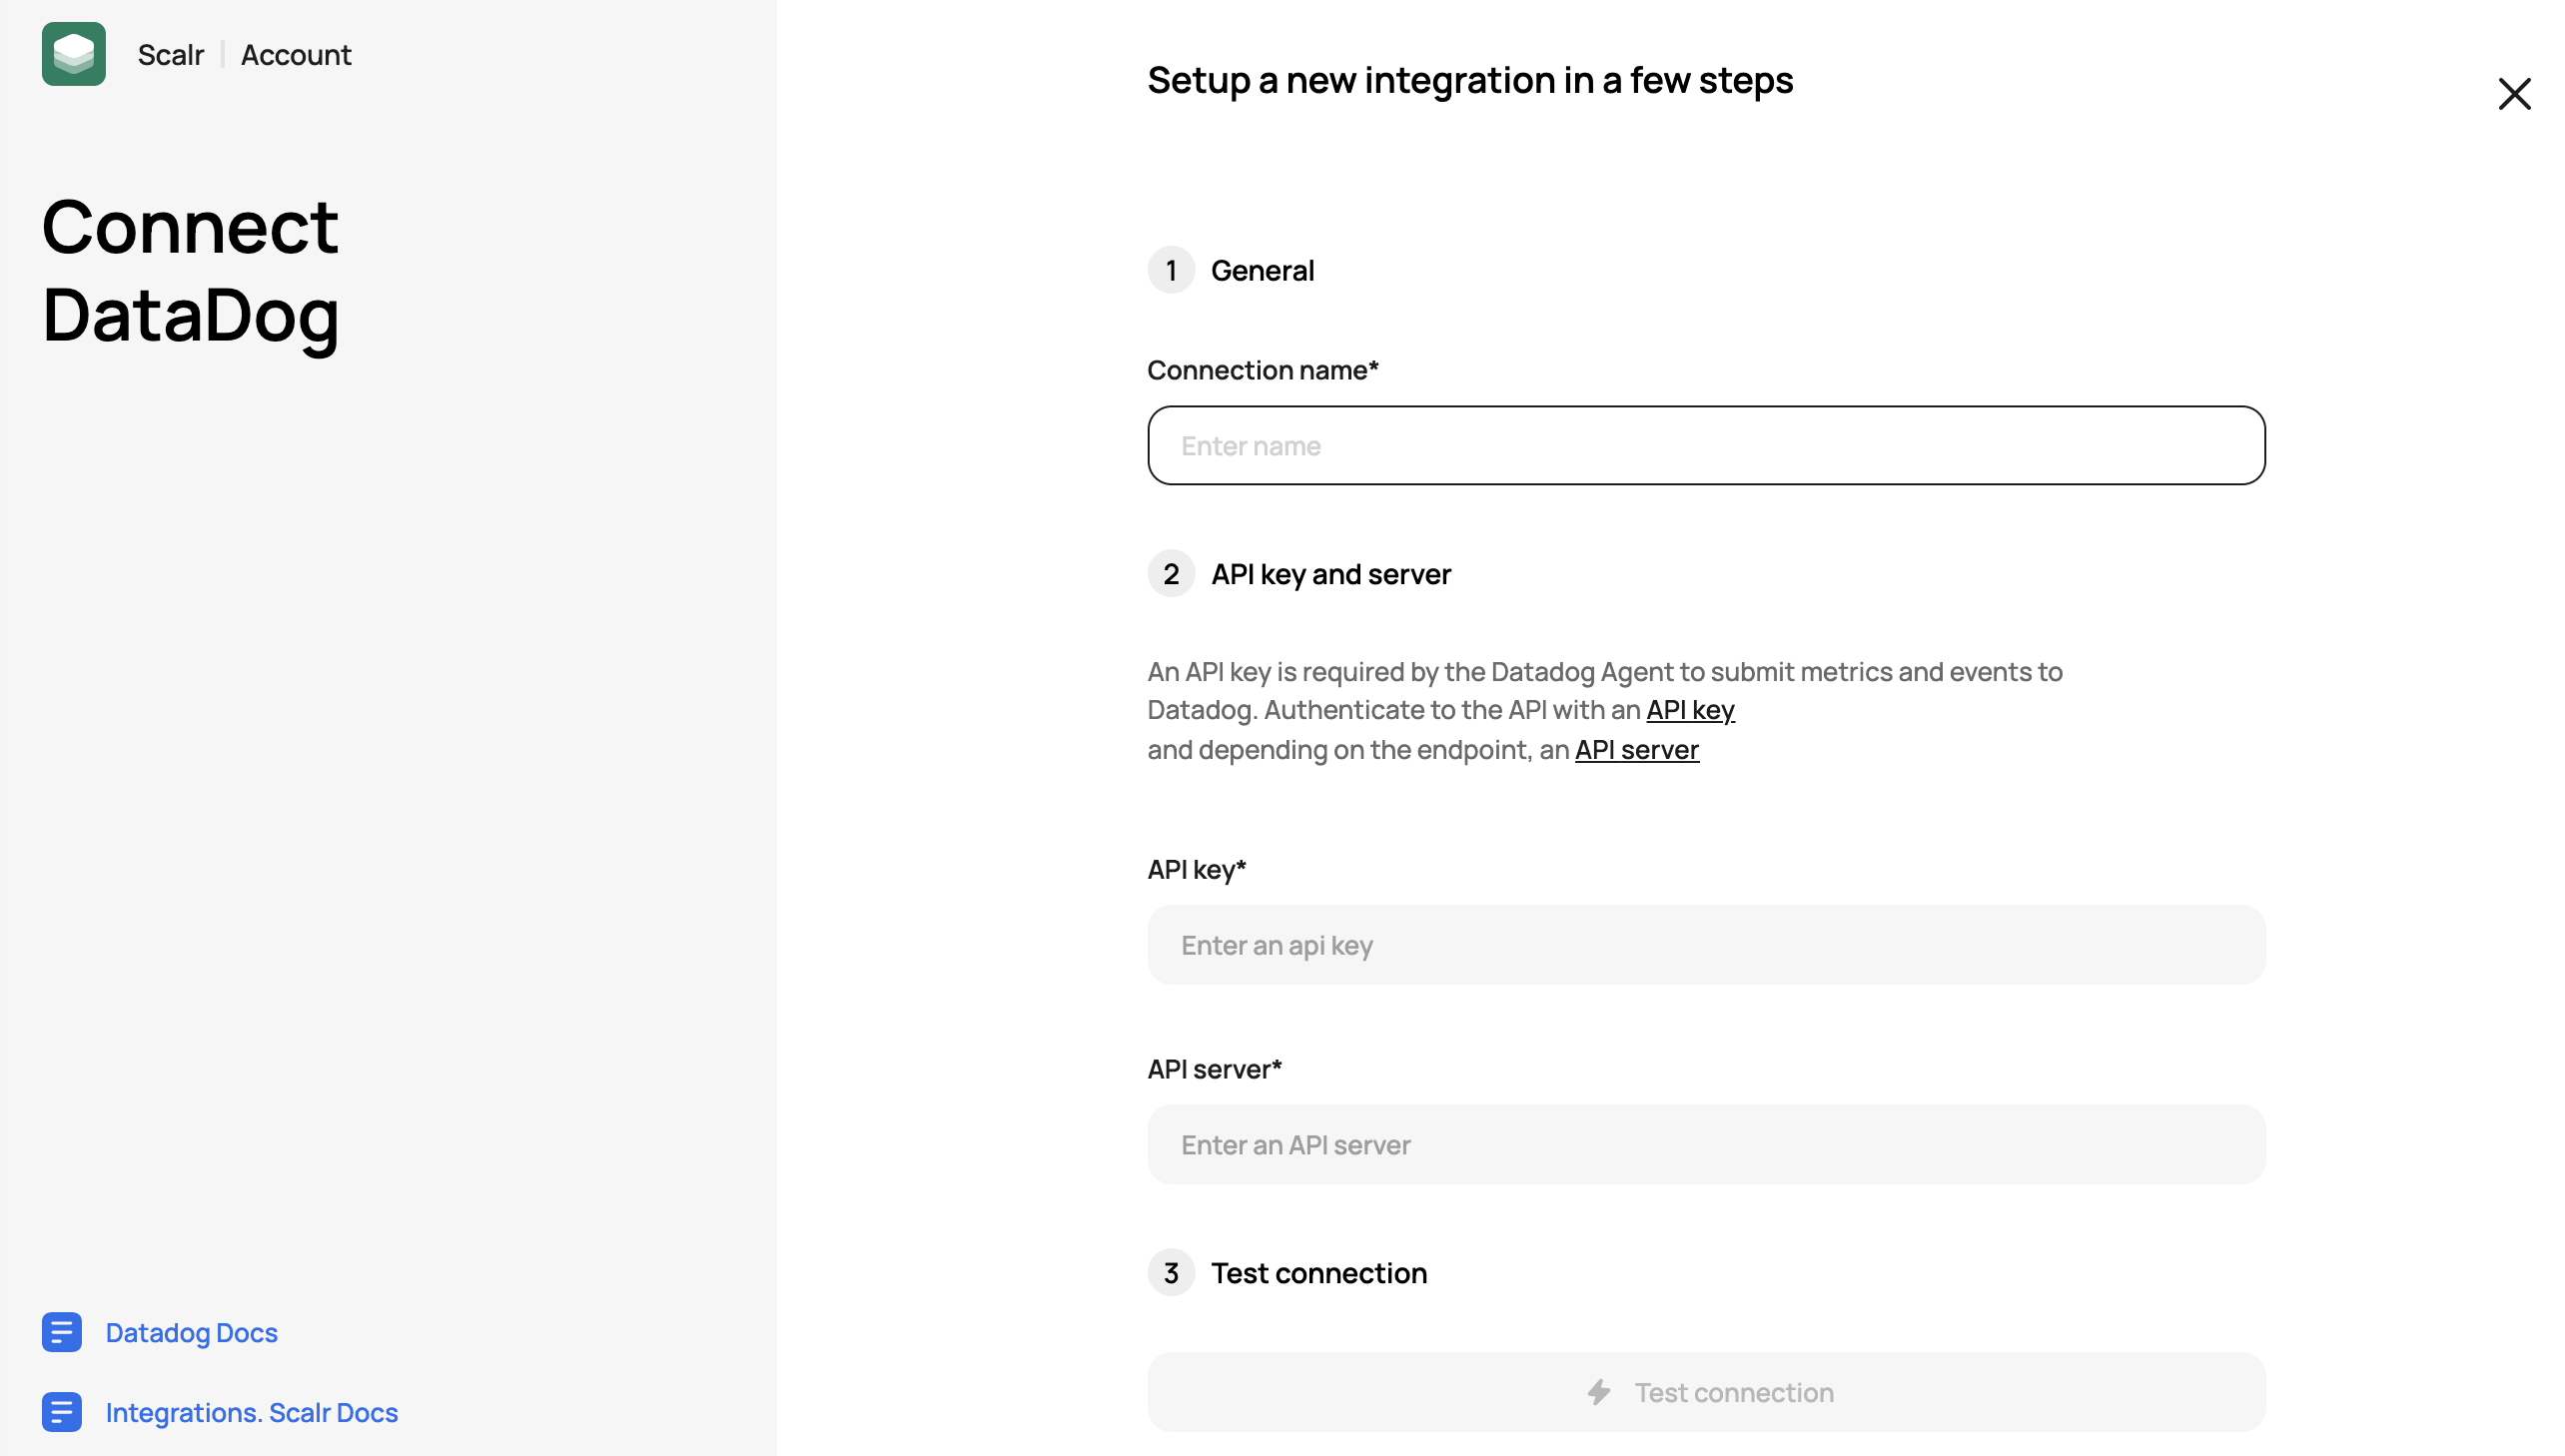
At this point, just select the necessary connections, and the integration is complete. You will now see run events in Datadog, including the status, VCS information, provider configurations used, and more:
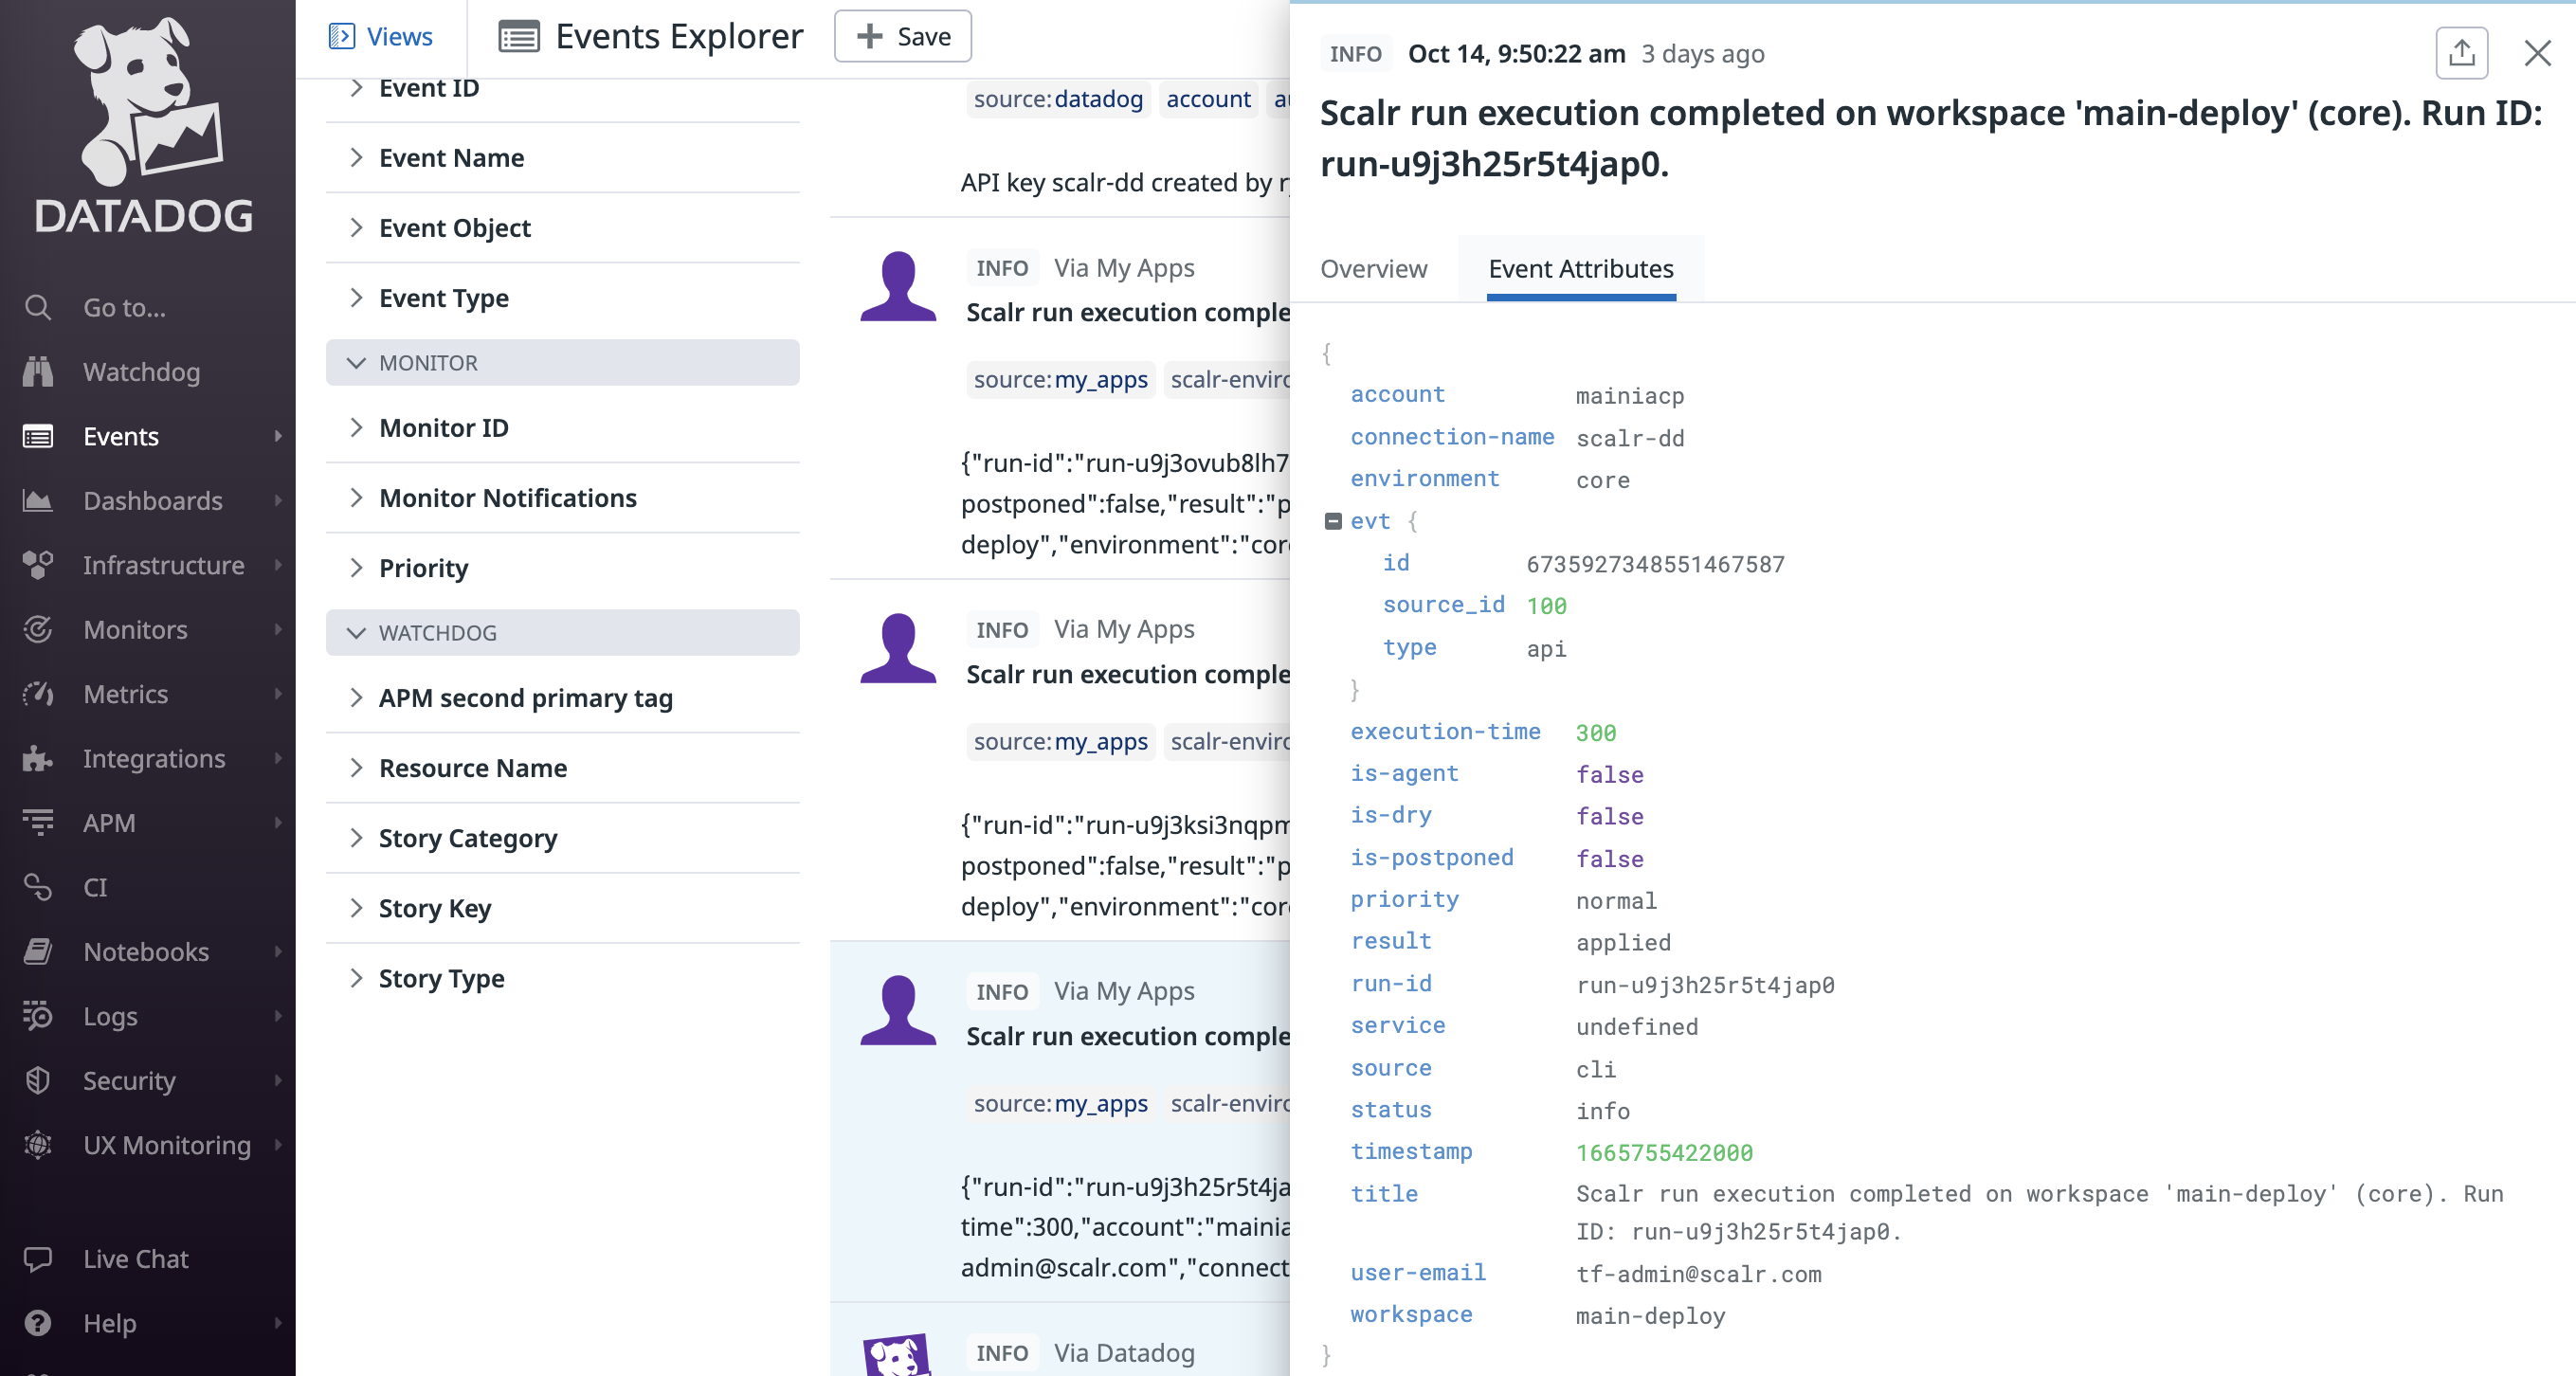
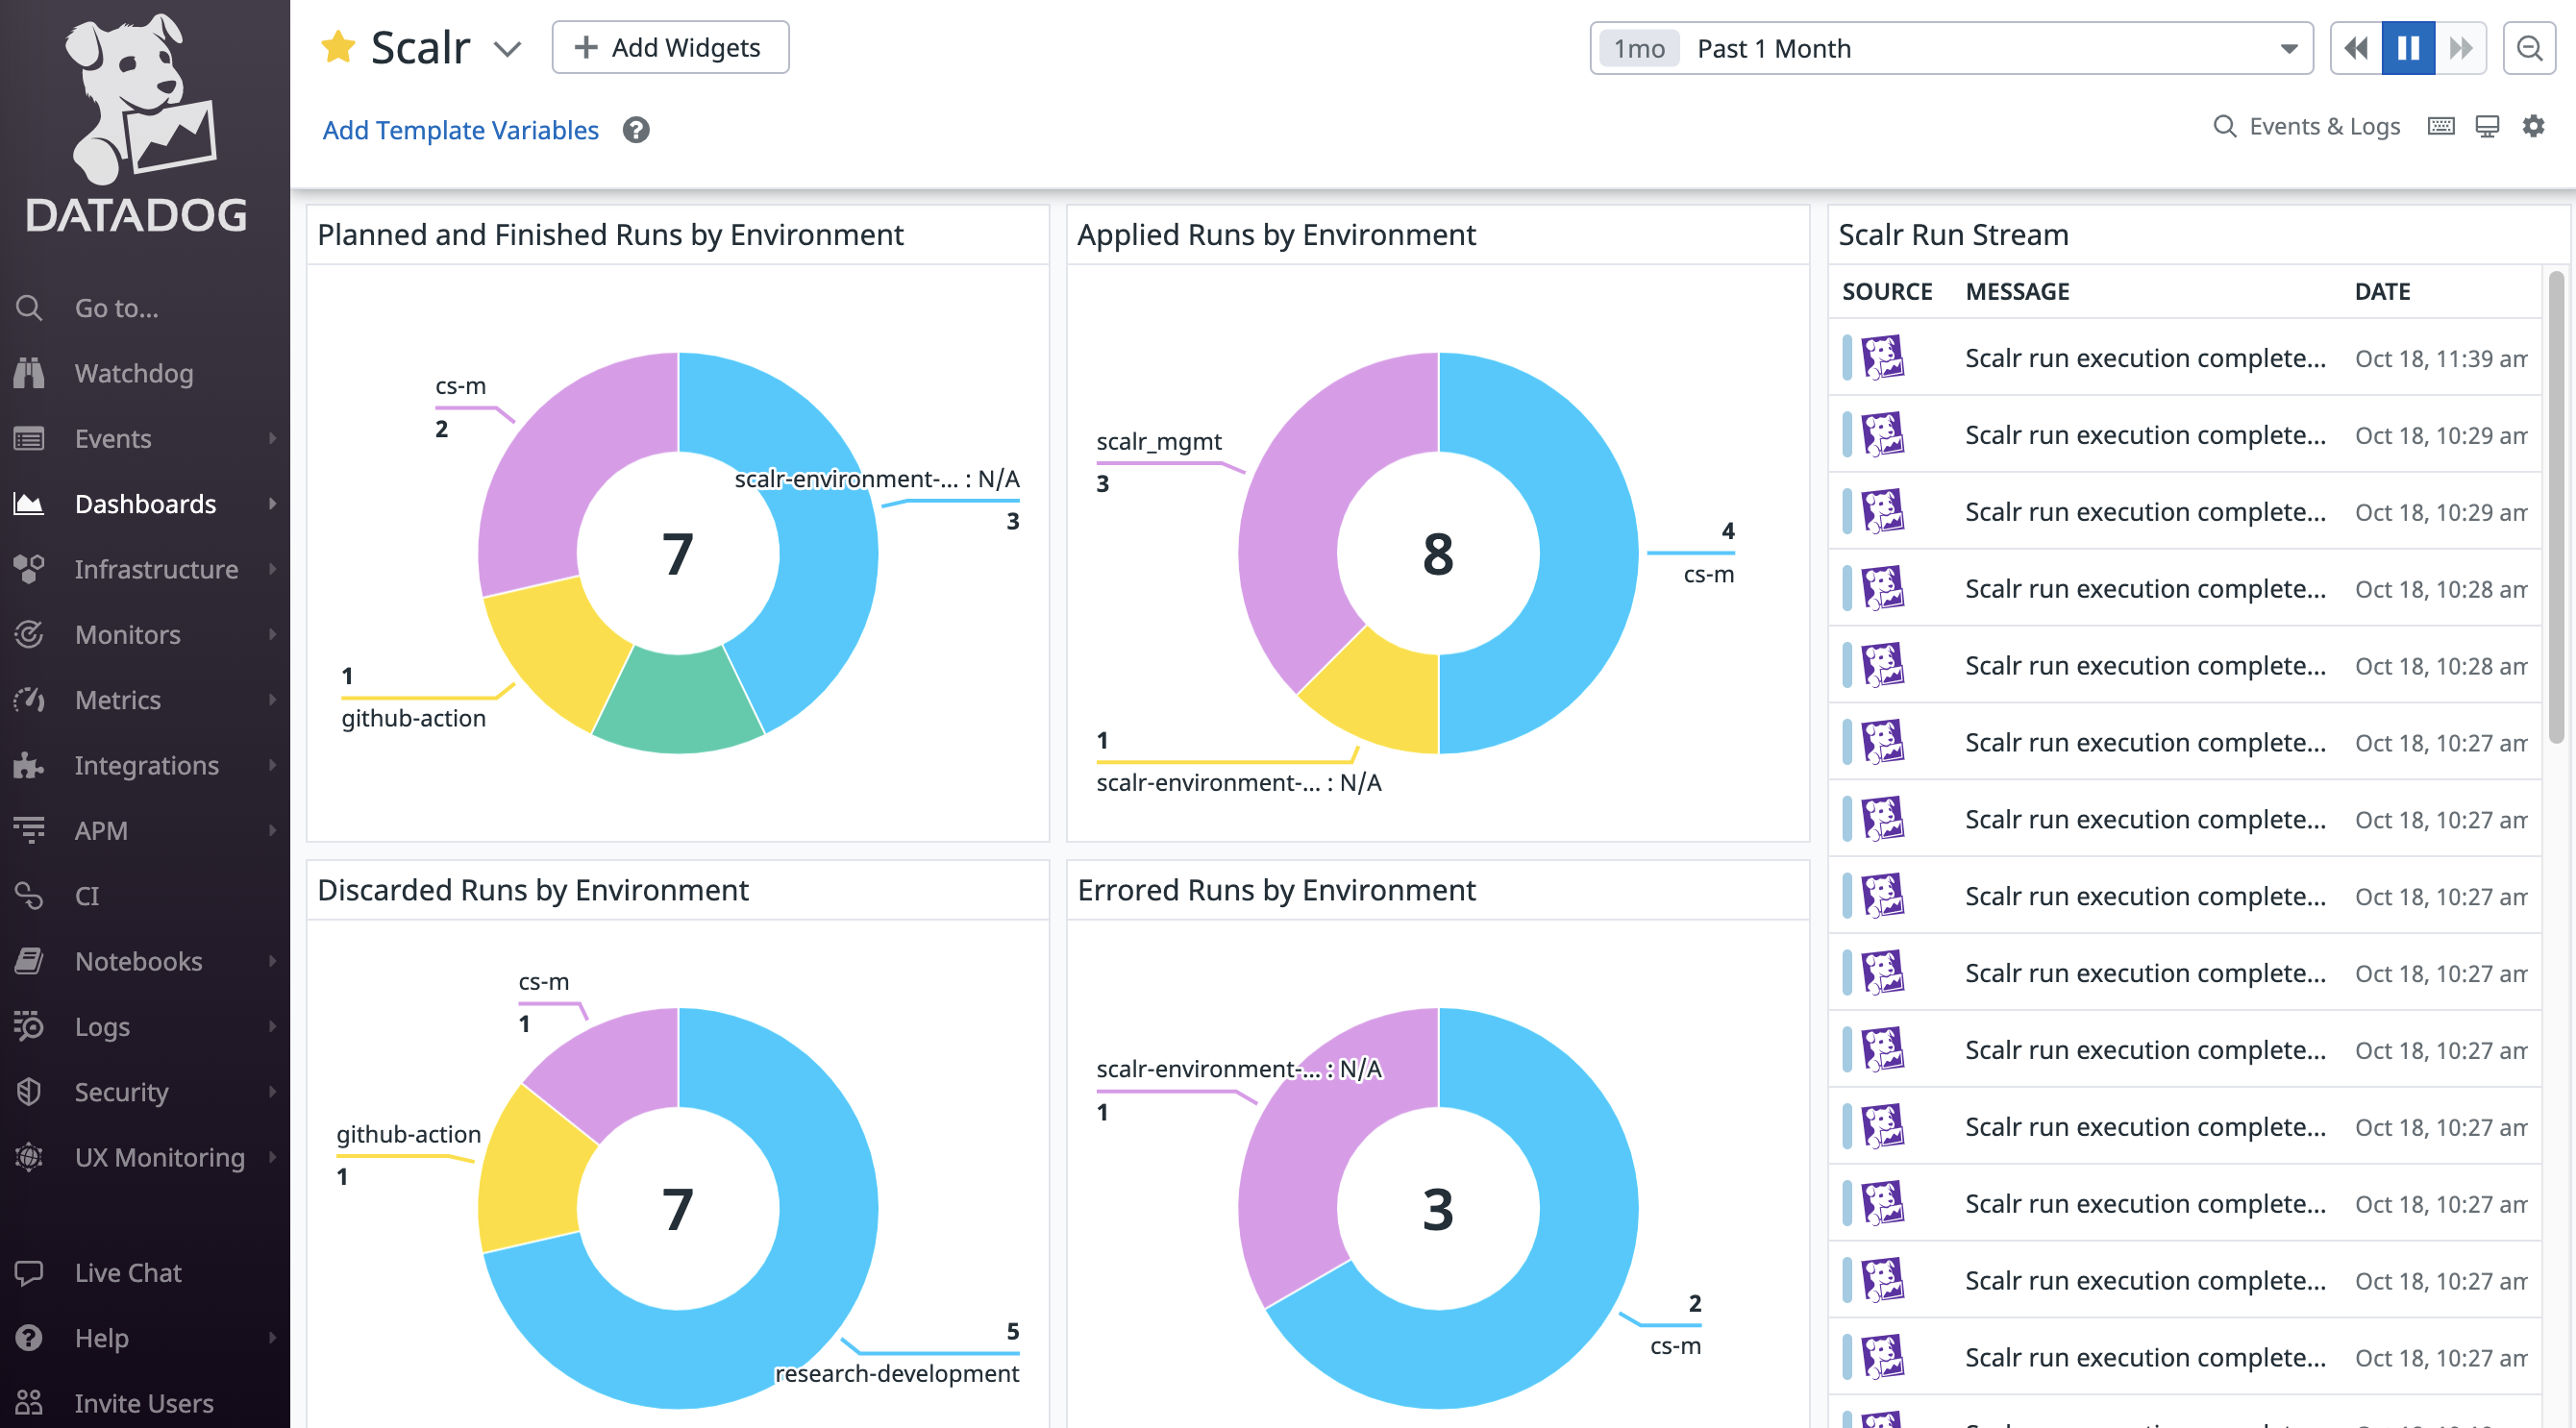
You can now build reports and dashboards in Datadog to analyze your Terraform events. For example, break down run results per environment:
Metrics
Send metrics to Datadog for in-depth analysis and reporting such as queue runs, queue state, the number of environments, and workspace count. These metrics are visualized in their out-of-the-box dashboard to help correlate deployments with other infrastructure changes and to track trends within your pipeline.
See how to install the Datadog agent and enable the Scalr integration here. The permission needed for the token in the agent is accounts:read. Only current metrics will be sent to Datadog, no historical information.
| Metric | Descriptions |
|---|---|
| scalr.environments.count | Total number of environments |
| scalr.workspaces.count | Total number of workspaces |
| scalr.runs.count | Total number of runs |
| scalr.runs.successful | Number of runs in applied or planned_and_finished status |
| scalr.runs.failed | Number of runs in an errored status |
| scalr.runs.awaiting_confirmation | Number of runs in planned, policy_checked, policy_override, cost_estimated status |
| scalr.runs.concurrency | Number of runs in planning, policy_checking, cost_estimating, applying status |
| scalr.runs.queue_size | Number of runs in plan_queued or apply_queued status |
| scalr.quota.max_concurrency | The quota.max_concurrent_runs value (account quota) |
| scalr.billing.runs.count | The number of runs in the current billing period |
| scalr.billing.run_minutes.count | The number of run minutes used in the current billing period |
| scalr.billing.flex_runs.count | The number of flex runs used in the current billing period |
| scalr.billing.flex_run_minutes.count | The number of run minutes used in current billing period |
You can also utilize the Scalr integrations dashboard by default by going to Dashboards->Integrations in Datadog:

Audit Logs
Audit logs allow you to get insights into all actions taken, who performed the action, how it was done, and more. The audit log feature can use the same Datadog connection that is used for events or a new one can be created.
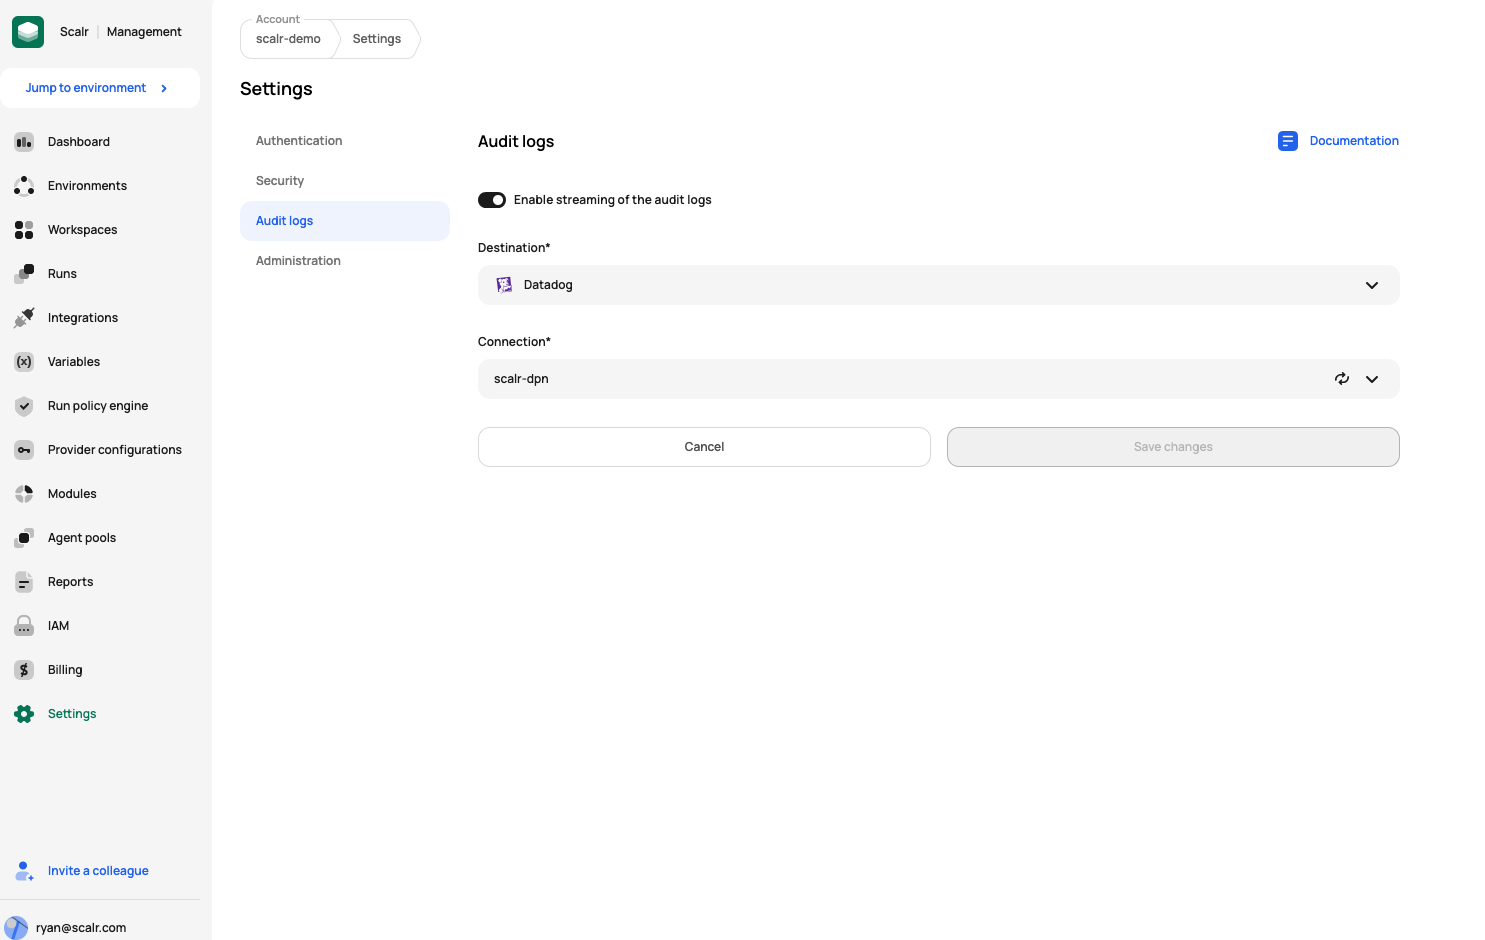
To enable audit logs, go to the account settings page and click on audit logs. Enable the streaming of logs, select Datadog as the destination, and add the connection:
You will now see the Scalr logs in the Datadog logs feature:
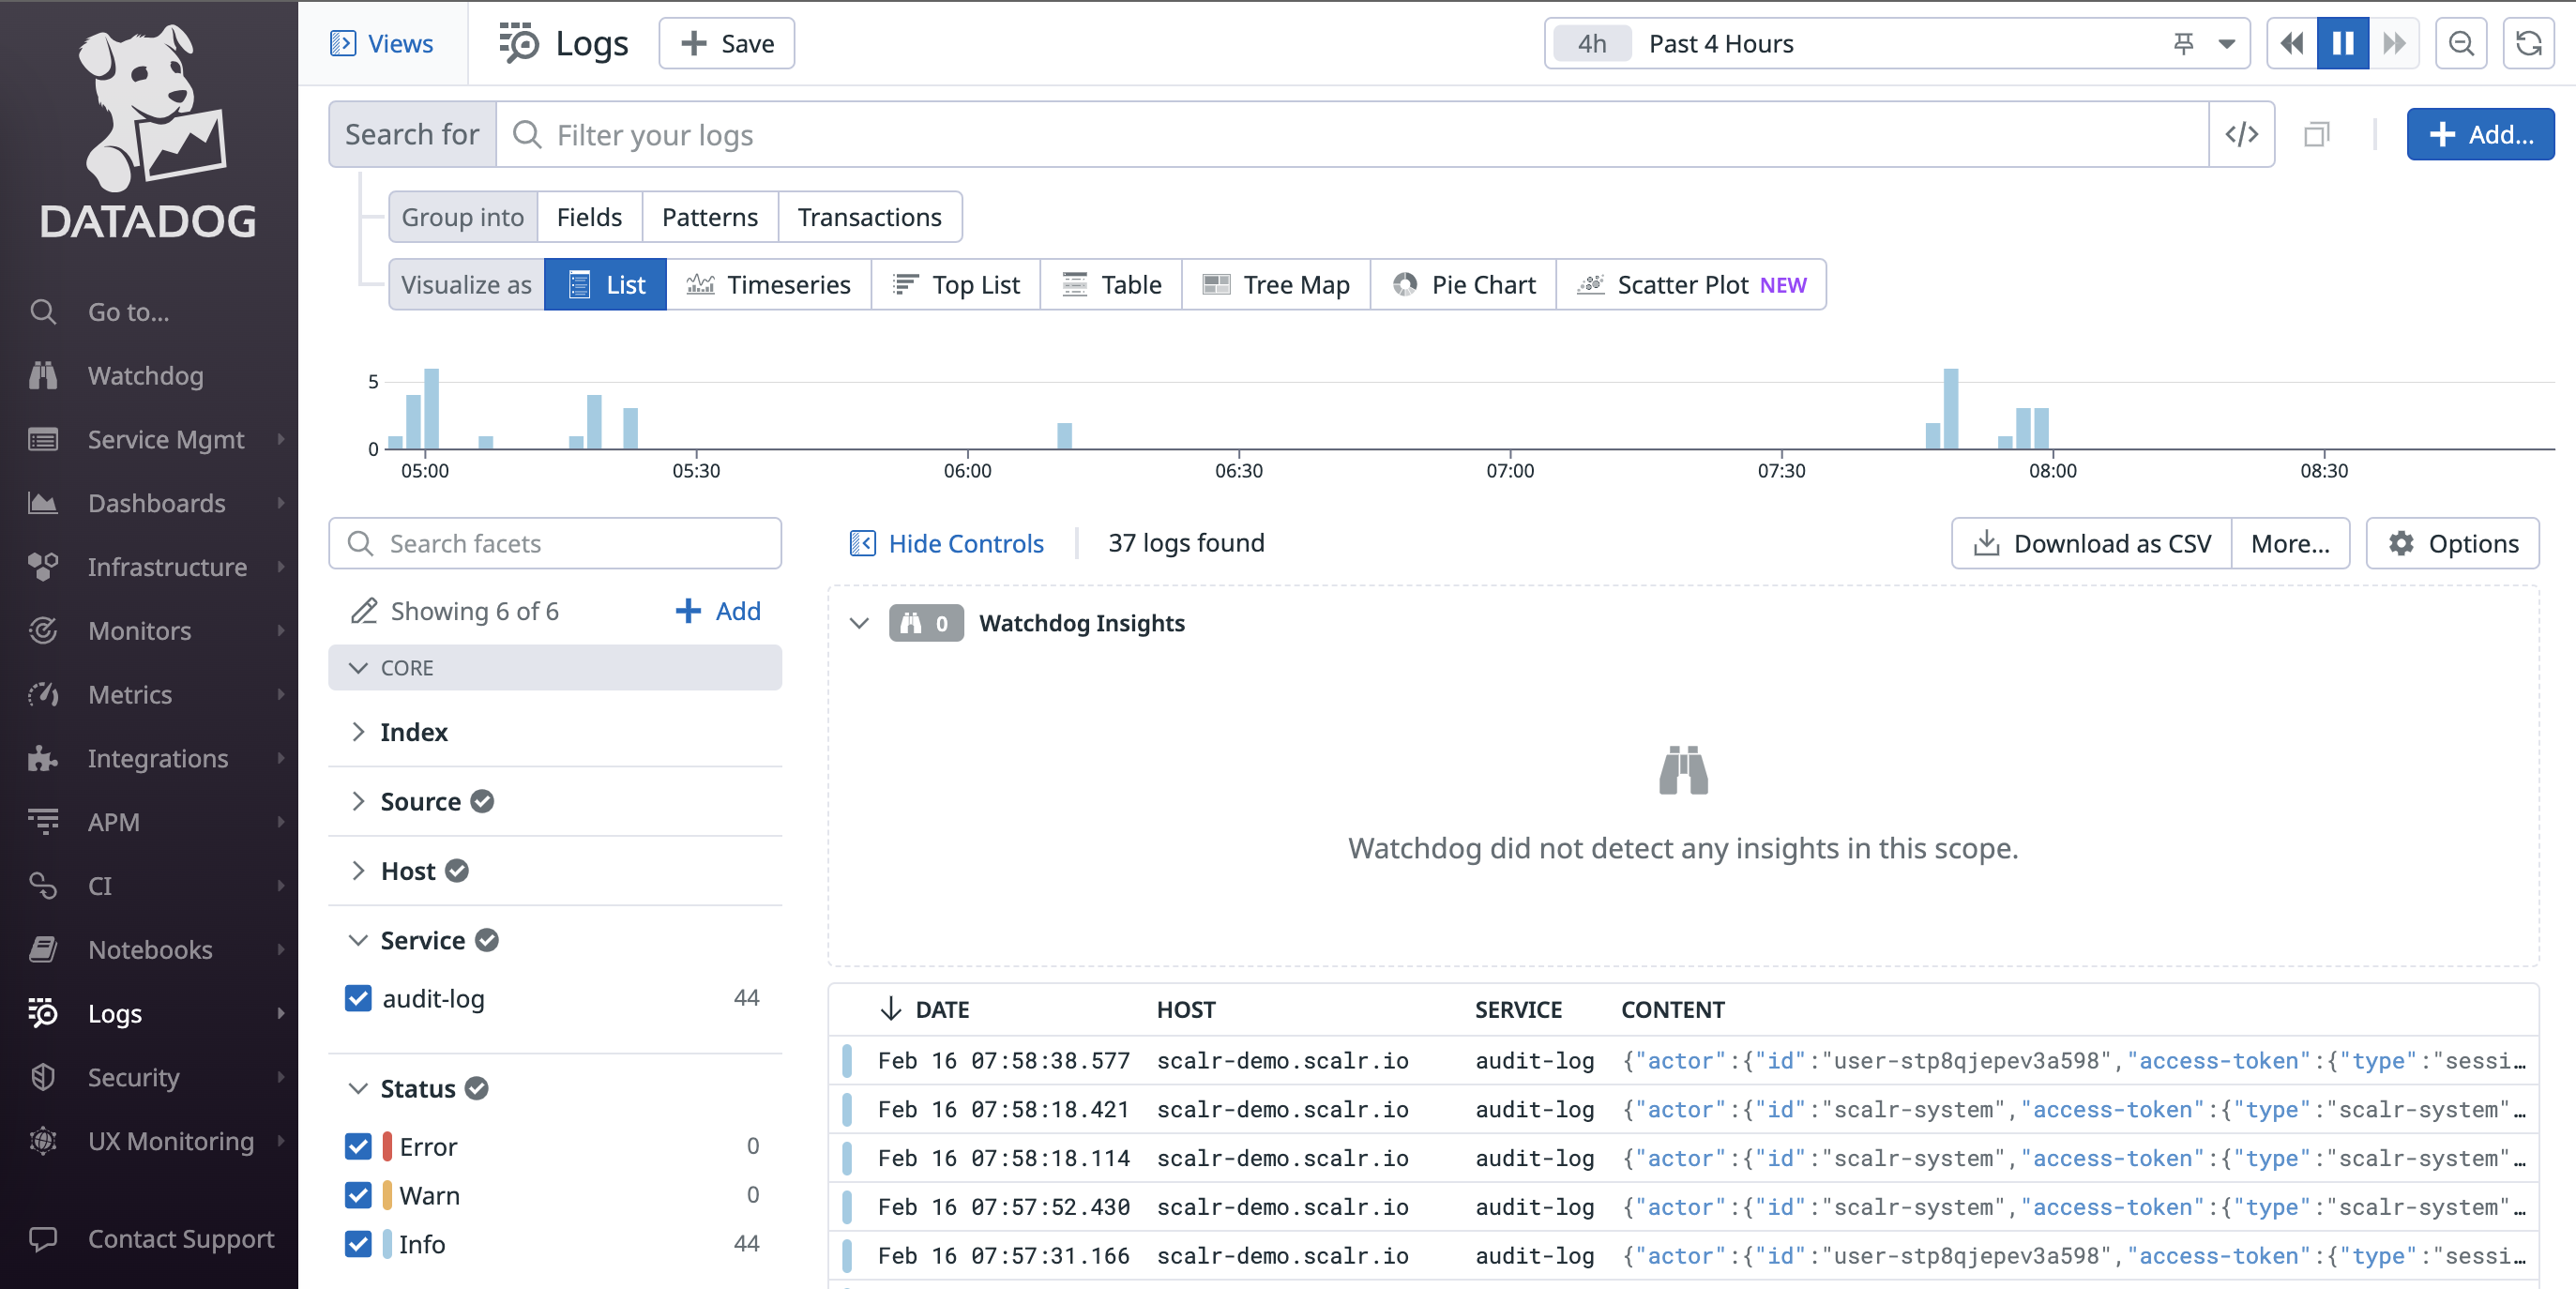
Here is an example of a full log output:
{
	"id": "AgAAAY2x_1pxzx914QAAAAAAAAAYAAAAAEFZMnhfMXRKQUFDY1RCNUtZb3FoTlFBQQAAACQ12345656E4ZGIxZmYtNWE3MS00MTU3LWJlMTctODhmMTZhYTU5Nzhl",
	"content": {
		"timestamp": "2024-02-16T12:58:38.577Z",
		"tags": [
			"scalr-workspace-name:demo-ws",
			"scalr-environment-name:cs-m",
			"scalr-workspace:ws-v0o370ouv5kbjmk9h",
			"scalr-user-email:[email protected]",
			"scalr-action:discard-run",
			"scalr-environment:org-sscctbkdgkdr123",
			"source:scalr",
			"datadog.submission_auth:private_api_key"
		],
		"host": "docs.scalr.io",
		"service": "audit-log",
		"attributes": {
			"actor": {
				"id": "user-stp8qjepev3a123",
				"access-token": {
					"type": "session",
					"token": "...B6wifA"
				},
				"type": "user",
				"email": "[email protected]"
			},
			"request": {
				"ip-address": "69.206.111.123",
				"action": "discard-run",
				"id": "a3a473d725c730382558c25d52bd1234",
				"source": "ui",
				"user-agent": "Mozilla/5.0 (Macintosh; Intel Mac OS X 10_15_7) AppleWebKit/537.36 (KHTML, like Gecko) Chrome/121.0.0.0 Safari/537.36"
			},
			"hostname": "docs.scalr.io",
			"service": "audit-log",
			"outcome": {
				"result": "SUCCESS",
				"status-code": 202
			},
			"target": {
				"display-name": "run-v0o370pcff0e53123",
				"context": {
					"environment": {
						"display-name": "CS-M",
						"id": "org-sscctbkdgkdrqg0"
					},
					"workspace": {
						"display-name": "demo-ws",
						"id": "ws-v0o370ouv5kbjmk9h"
					},
					"account": {
						"display-name": "docs",
						"id": "acc-sscctbisjkl3123"
					}
				},
				"id": "run-v0o370pcff0e53",
				"type": "runs"
			},
			"timestamp": "2024-02-16T12:58:38.577846"
		}
	}
}
Audit Log Disabled Alerts
To maintain compliance and visibility, Scalr sends an AuditLogDisabled event when audit log streaming is disabled or switched to a different destination. This ensures admins are immediately notified of changes that may introduce security or compliance risks.
Sample Message:
{
    "title": "Audit Log Disabled.",
    "timestamp": "2025-04-29T13:31:50.345890+00:00",
    "user-id": 17378,
    "user-email": "[email protected]",
    "disabled-integration": {
        "id": "in-v0ohugh97e91o0dk3",
        "name": "Datadog_DPN",
        "type": "Datadog"
    }
}
Demo
Updated 9 months ago
