Tracing
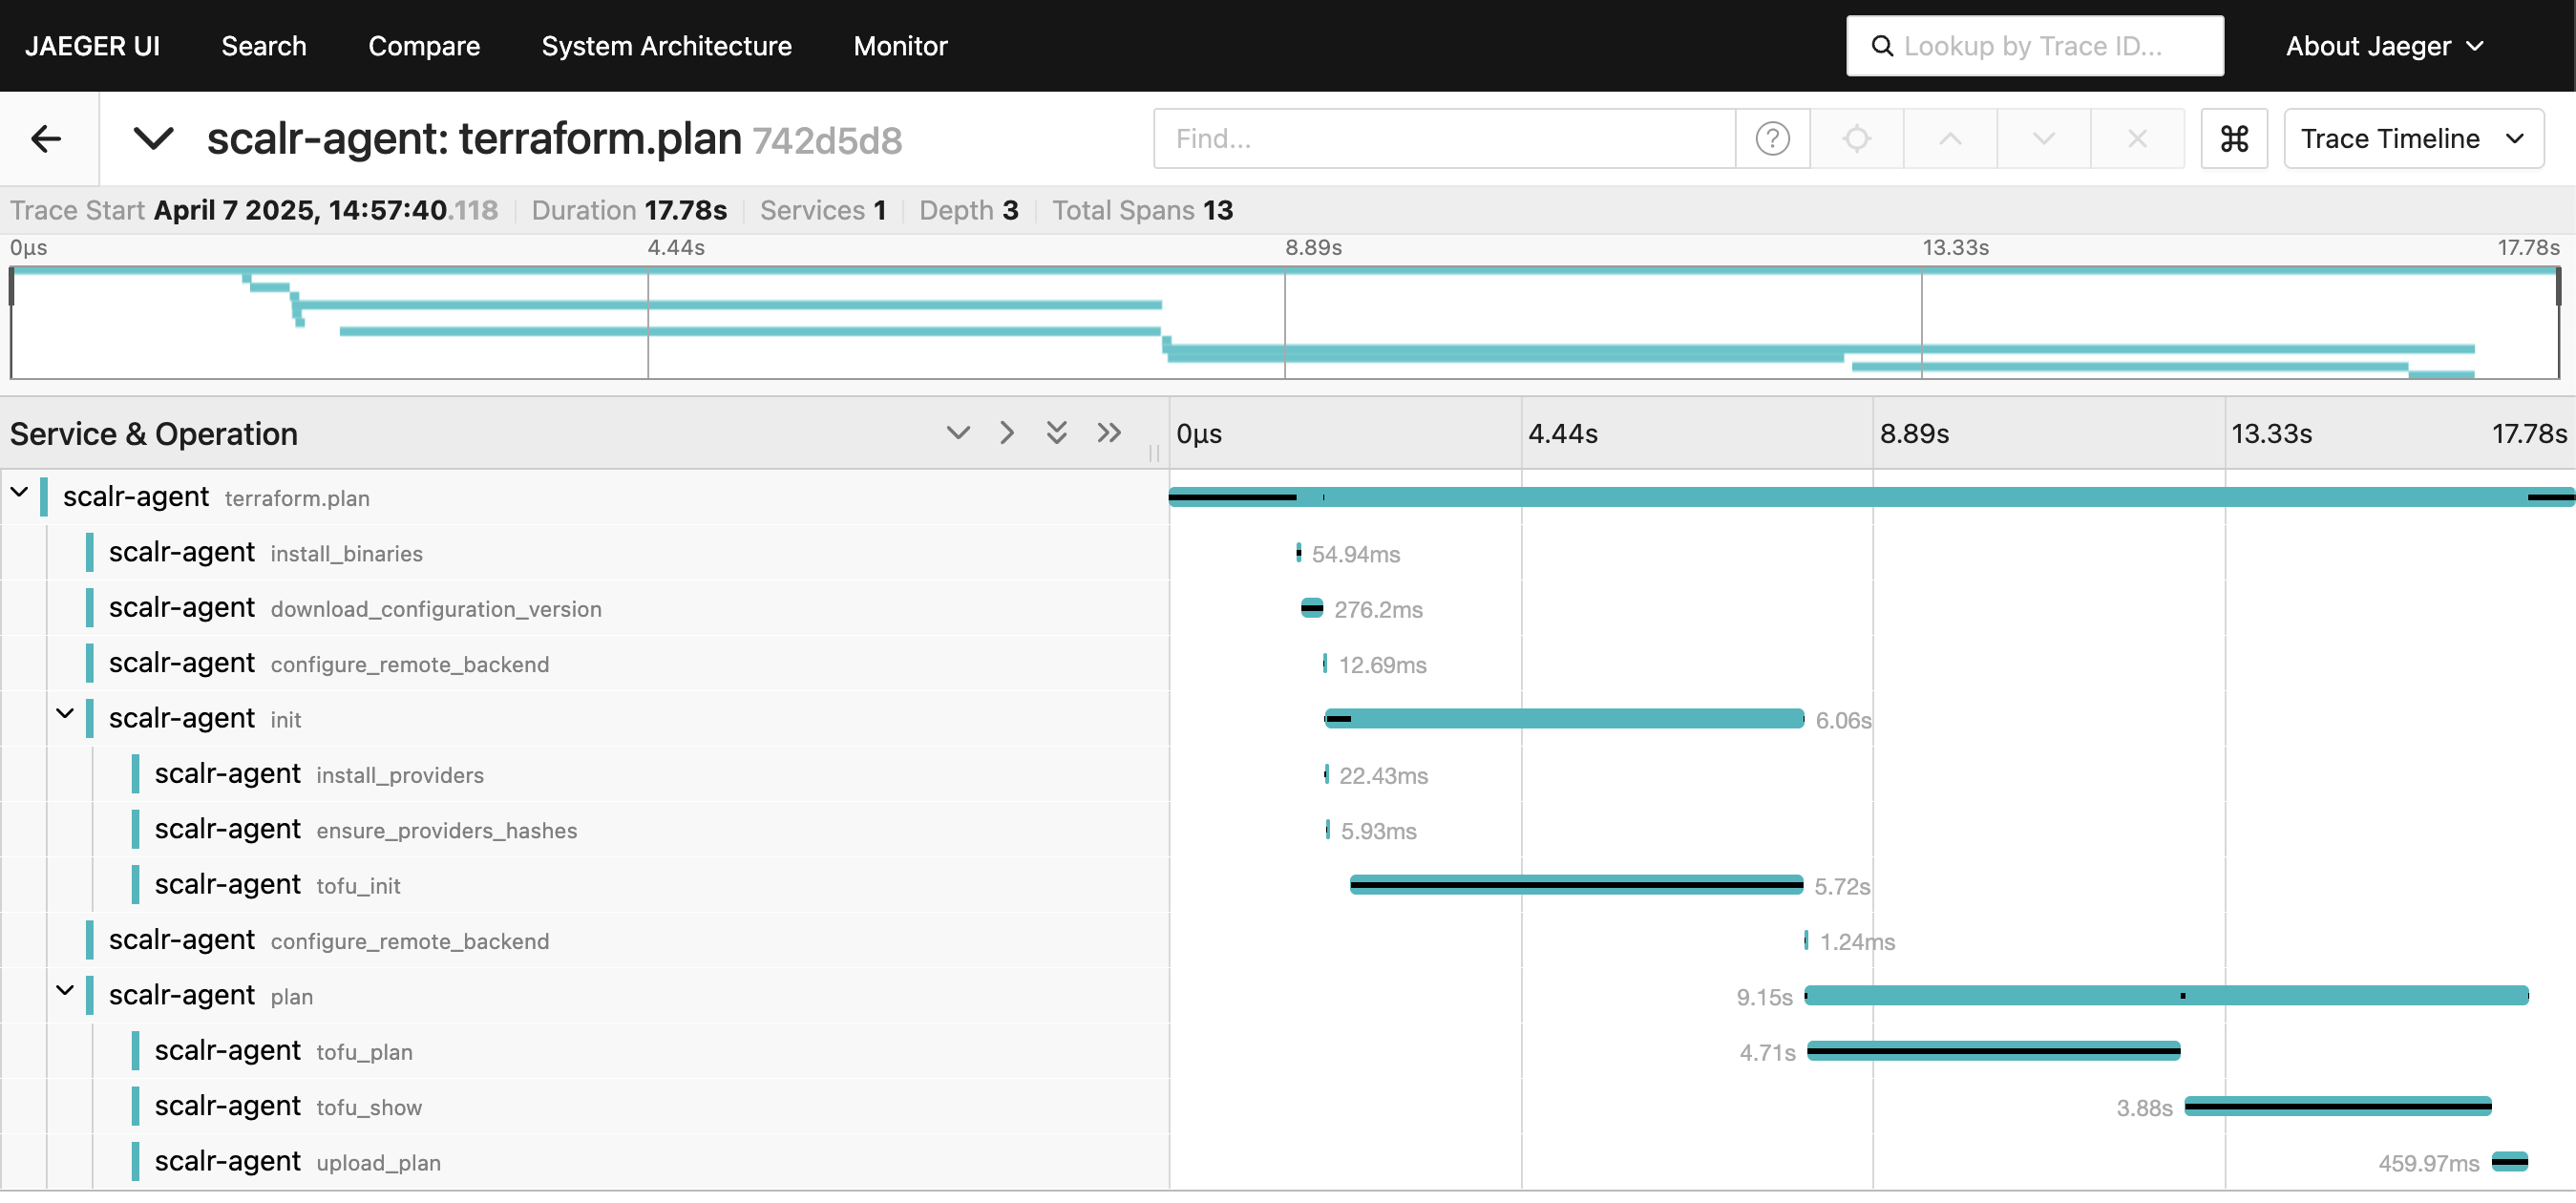
The Scalr Agent generates tracing spans, with each span representing a specific unit of work. These individual spans are nested within higher-level task spans that correspond to a single run stage, such as plan or apply.
Configuration
To enable this feature, set the SCALR_AGENT_OTLP_ENDPOINT environment variable to the host:port address of your OpenTelemetry collector – a gRPC server running an OTLP collector, and enable SCALR_AGENT_OTLP_TRACES_ENABLED option.
Local Setup with Jaeger
This example shows how to run the Scalr Agent with tracing enabled, using Docker and Jaeger.
First, start a Jaeger collector service:
$~ docker run --rm --name jaeger \
  -p 16686:16686 \
  -p 4317:4317 \
  -p 4318:4318 \
  -p 5778:5778 \
  -p 9411:9411 \
  jaegertracing/jaeger:2.3.0
Next, run the Scalr Agent with tracing enabled by setting the following environment variables:
$~ docker run --rm --name scalr-agent \
  -e SCALR_AGENT_OTLP_ENDPOINT=host.docker.internal:4317
  -e SCALR_AGENT_OTLP_TRACES=1
  scalr/agent:latest
Then open http://localhost:16686/search, trigger a Scalr run, and observe the generated traces:
Updated 5 months ago