

Grafana
The Grafana integration streams Scalr run events and audit logs to Grafana Cloud or a self-hosted Grafana Loki. Scalr sends the events as OpenTelemetry (OTLP) logs, so you can query them in Grafana Explore, build dashboards, and create alert rules.
Prerequisites
- A Grafana Cloud stack, or a self-hosted Grafana Loki 3.0 or later with the native OTLP endpoint.
- The endpoint must use HTTPS and be reachable from the public internet.
- A Scalr user with permission to manage integrations at the account scope.
Connect Grafana Cloud
To connect Grafana Cloud, you need a token, the OTLP endpoint, and the instance ID of your stack.
Create a token
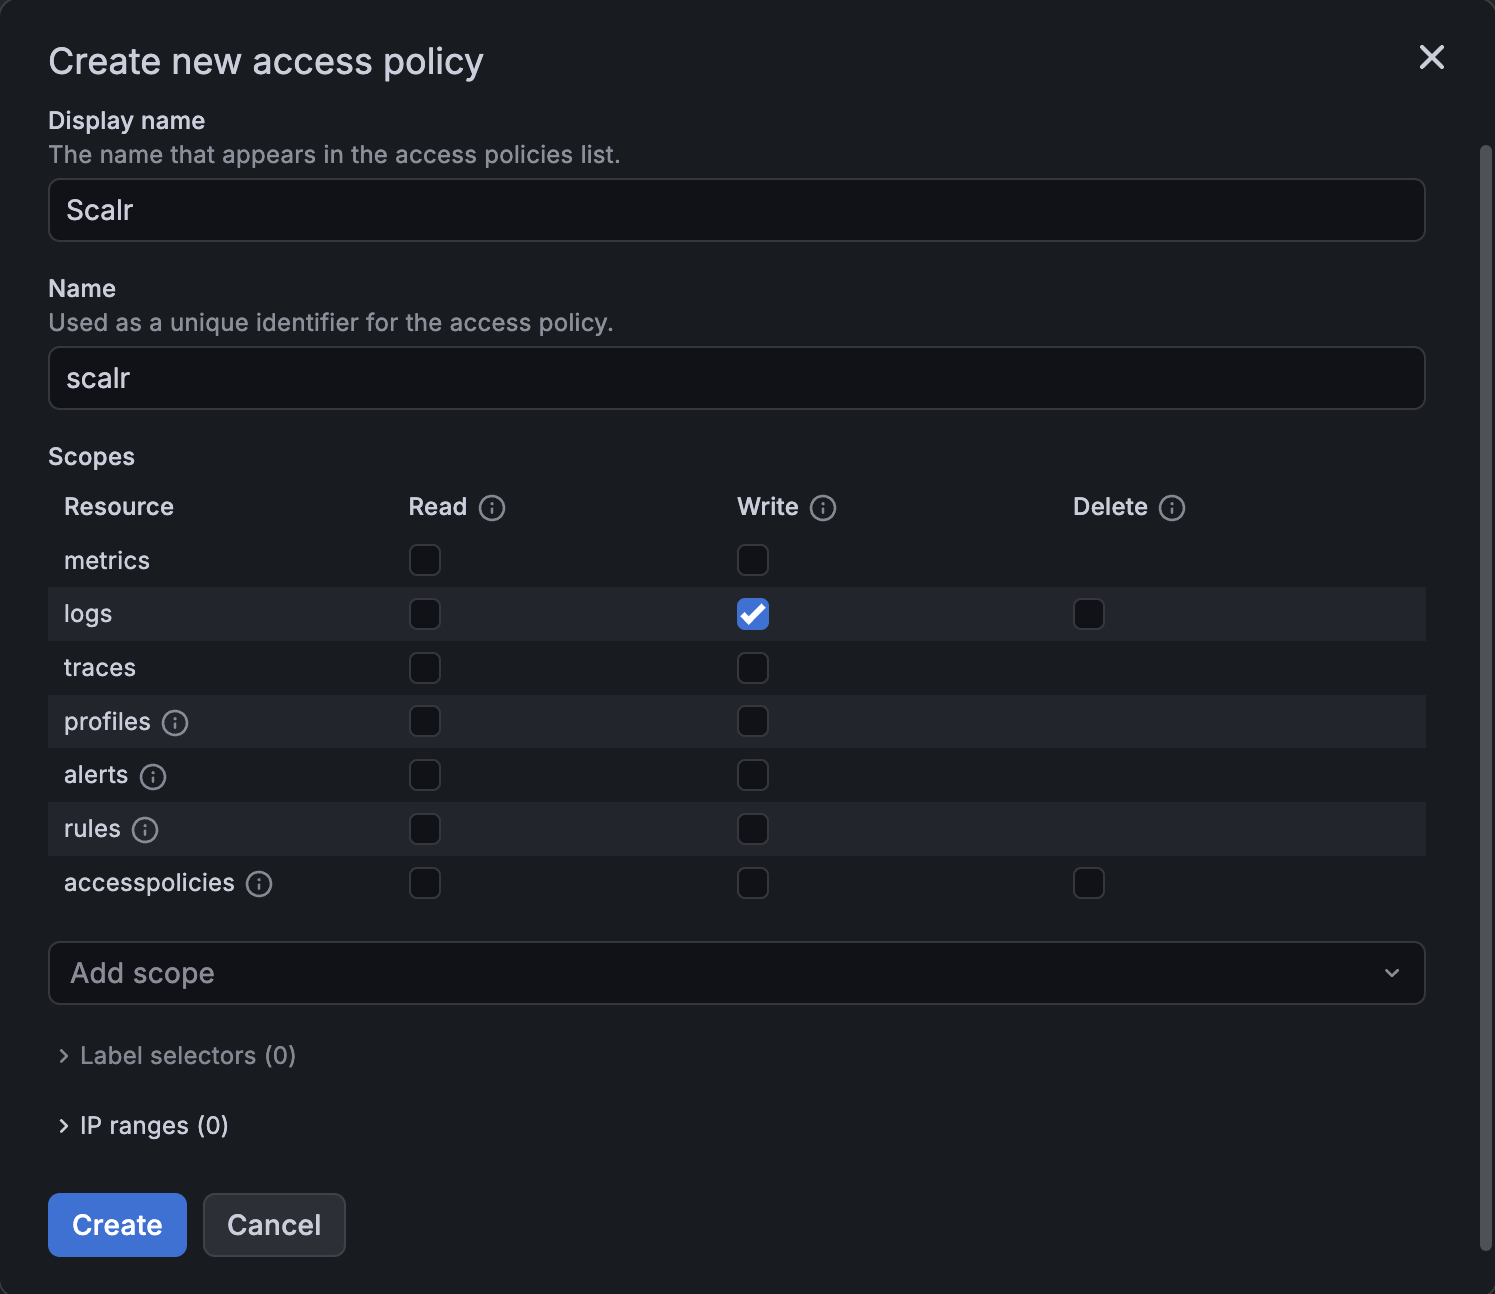
Scalr needs only the logs:write scope.
-
In Grafana, go to Administration > Users and access > Cloud access policies, and click Create access policy.
-
Enter a Display name and a Name. Under Scopes, select Write in the logs row, then click Create.
-
On the new policy, click Add token. Enter a Token name, select an Expiration date, and click Create.
-
Copy the token. Grafana shows it only once.
If a token expires, Scalr can no longer deliver events and sets the connection to the failed status.
Get the OTLP endpoint and instance ID
-
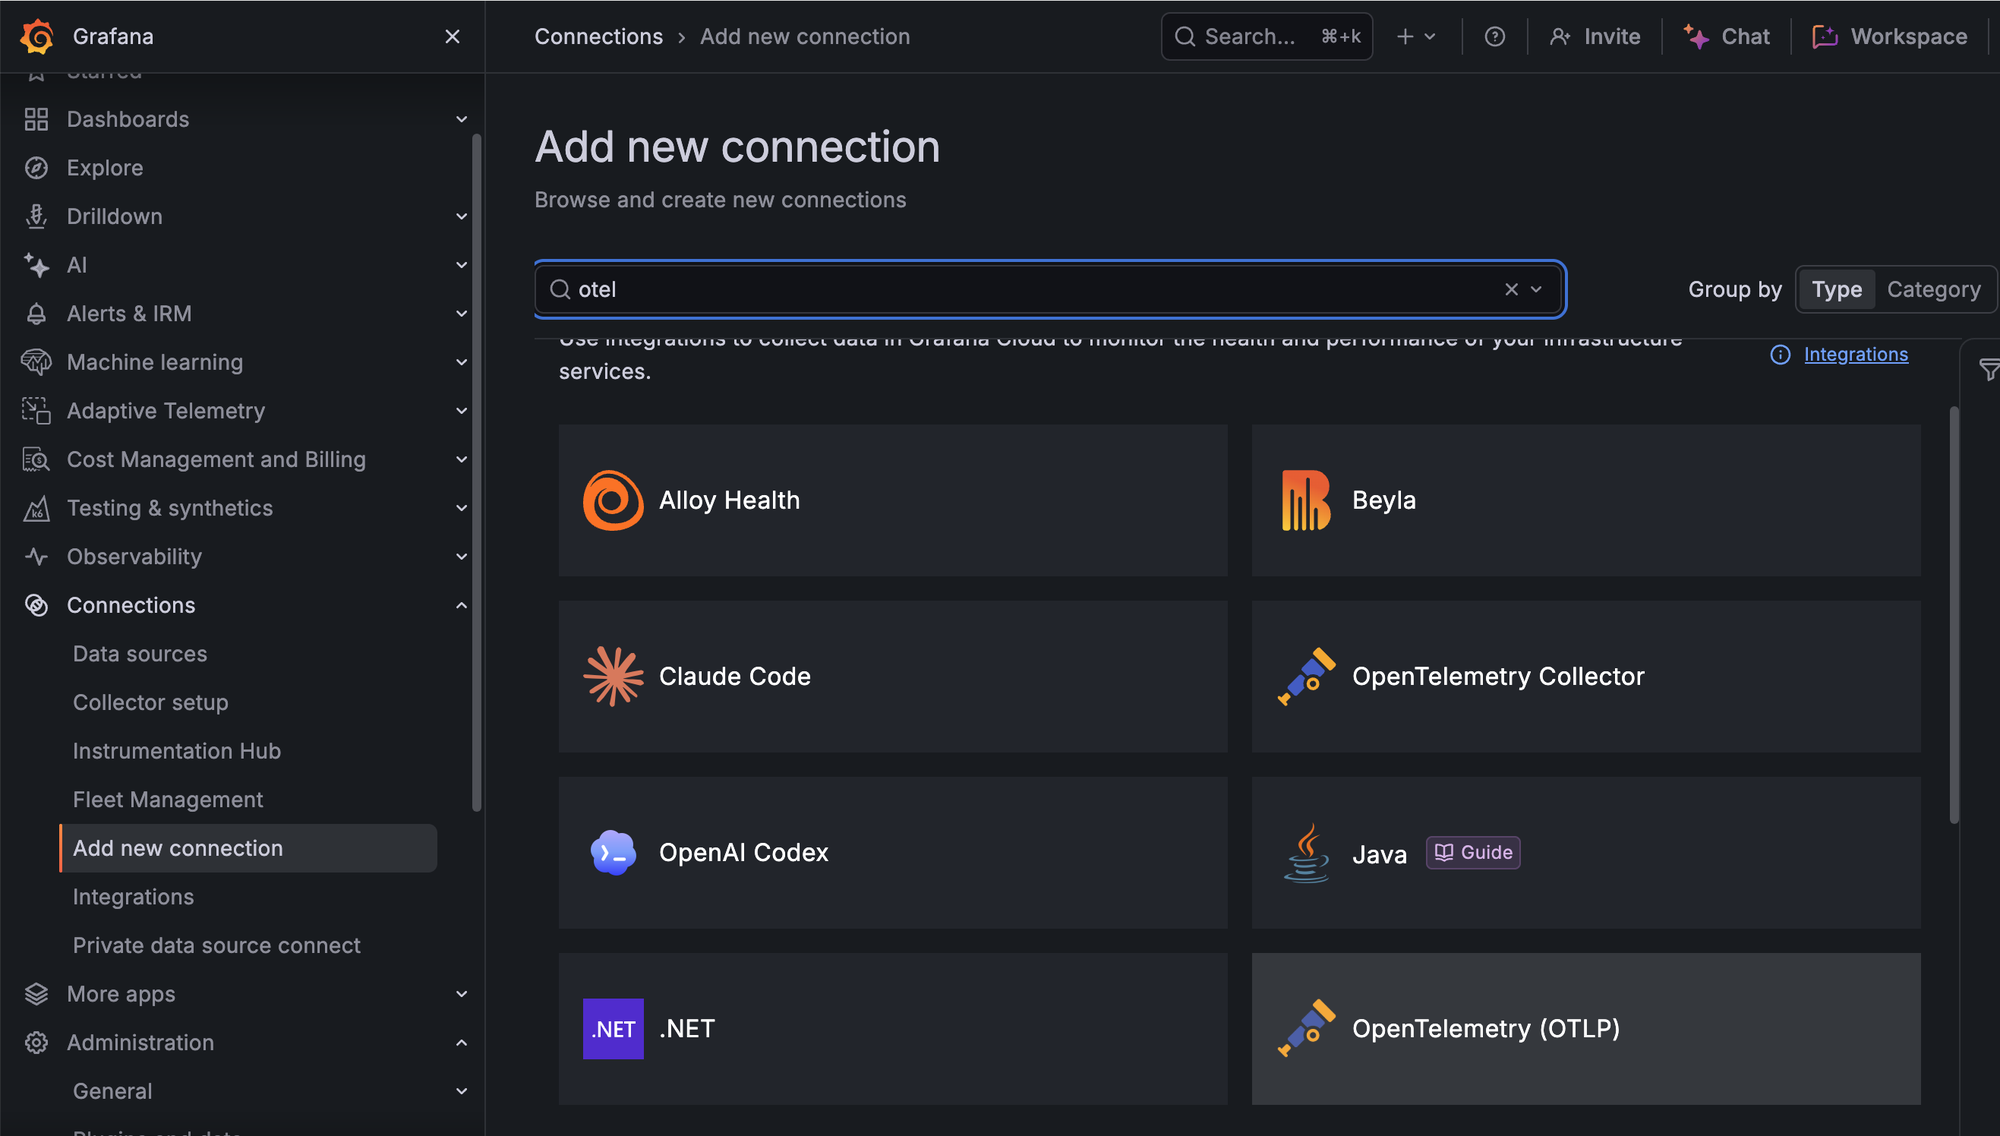
In Grafana, go to Connections > Add new connection, and select OpenTelemetry (OTLP).
-
On the OpenTelemetry setup page, select Serverless / Other, then click Next.
-
Under Create an API token, select Use an existing token, and paste the token you created in Create a token.
-
Copy the endpoint from
OTEL_EXPORTER_OTLP_ENDPOINT, for examplehttps://otlp-gateway-prod-us-central-0.grafana.net/otlp. -
Copy the instance ID from
OTEL_EXPORTER_OTLP_HEADERS. It is the number before the colon inbase64({instance ID}:<your-grafana-token>), and it is shown only until you click Use token.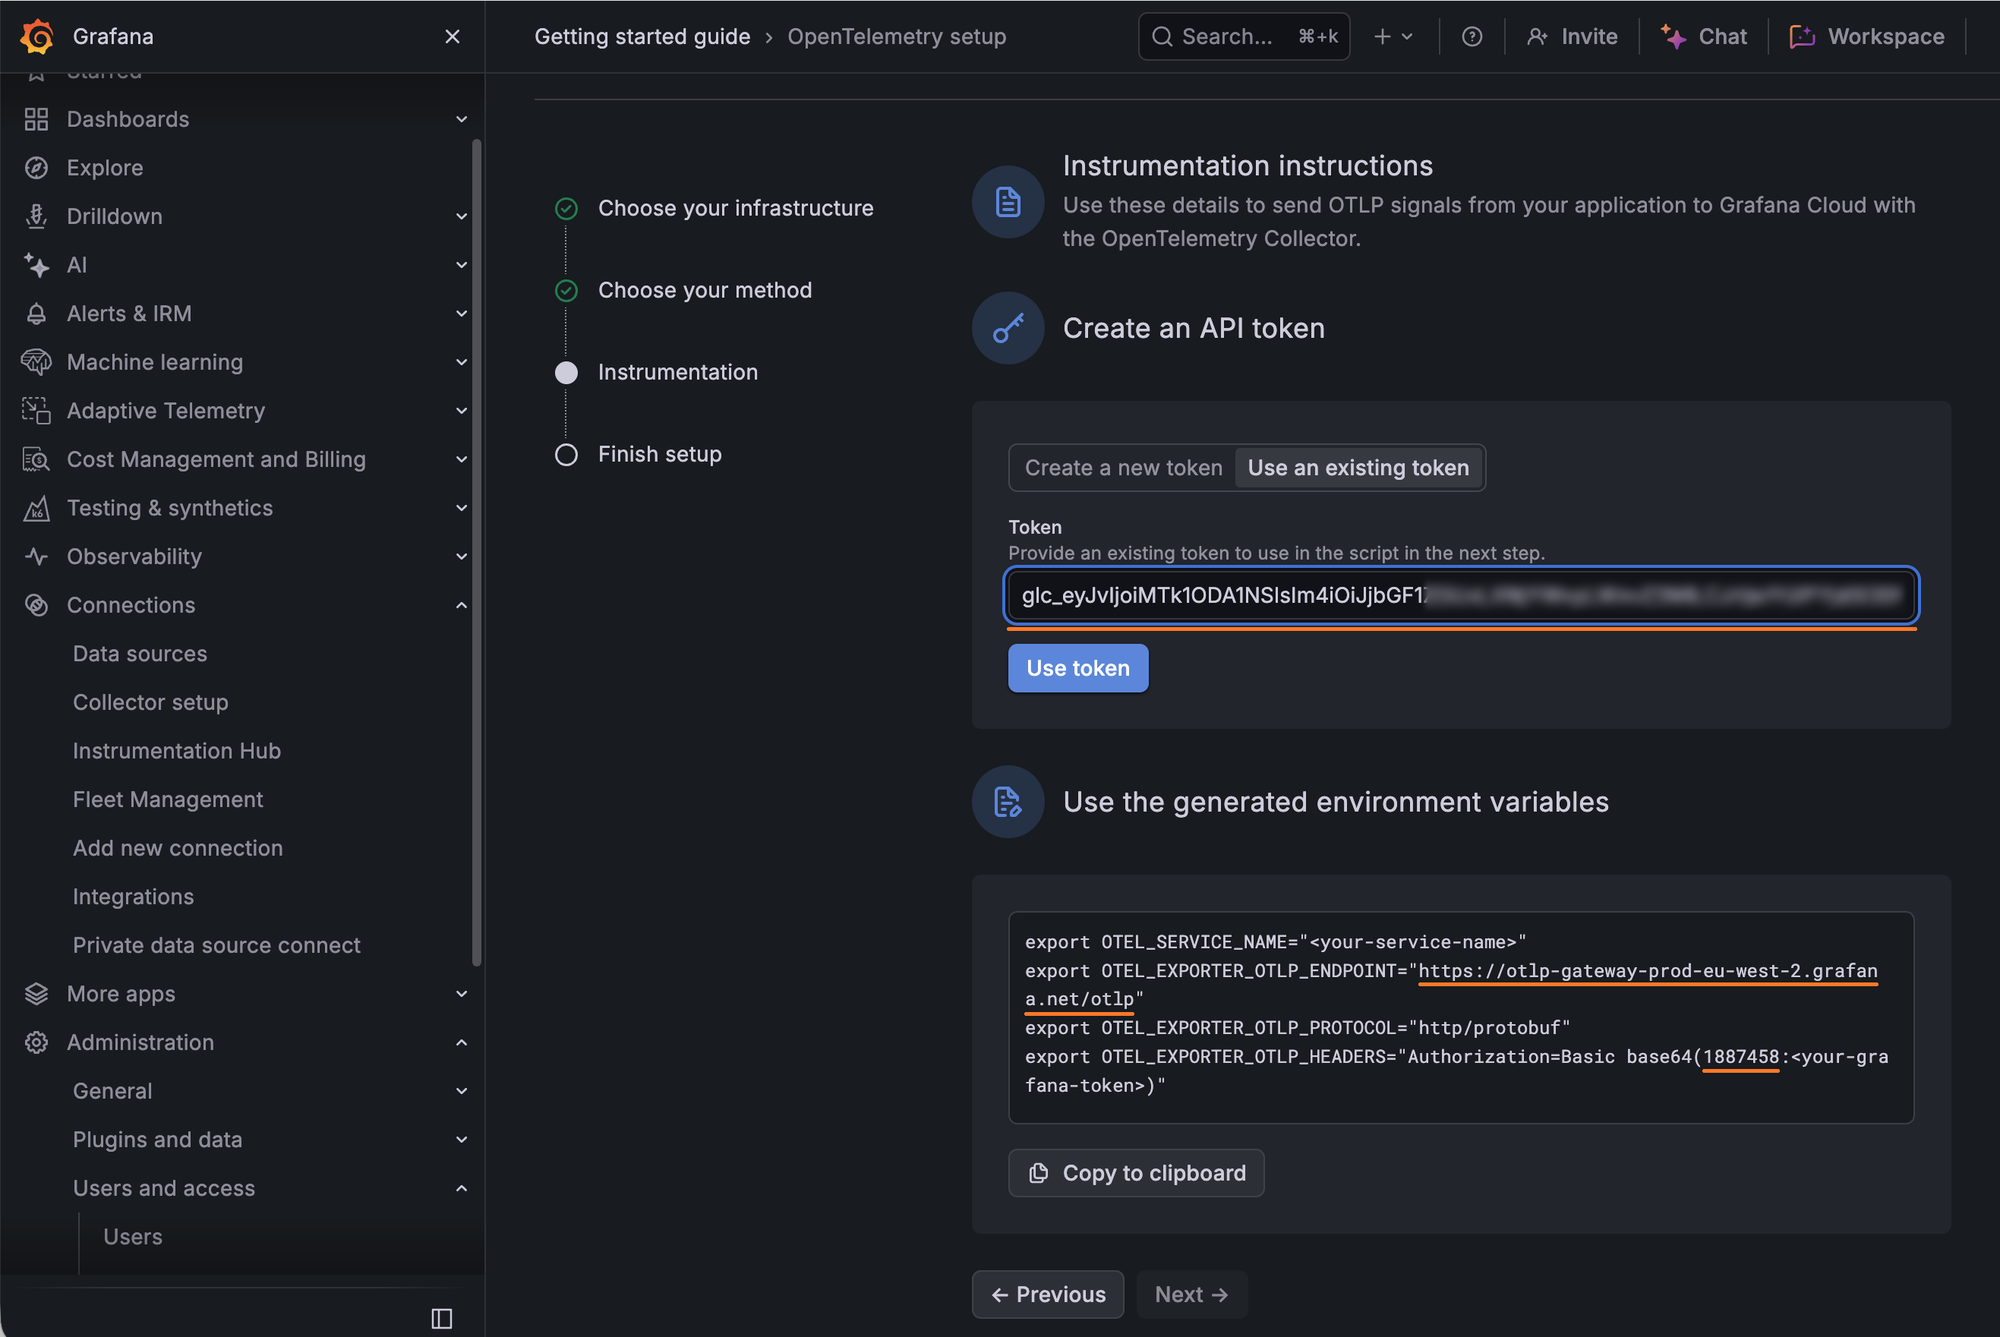
-
Click Use token, then click Next to finish the setup in Grafana.
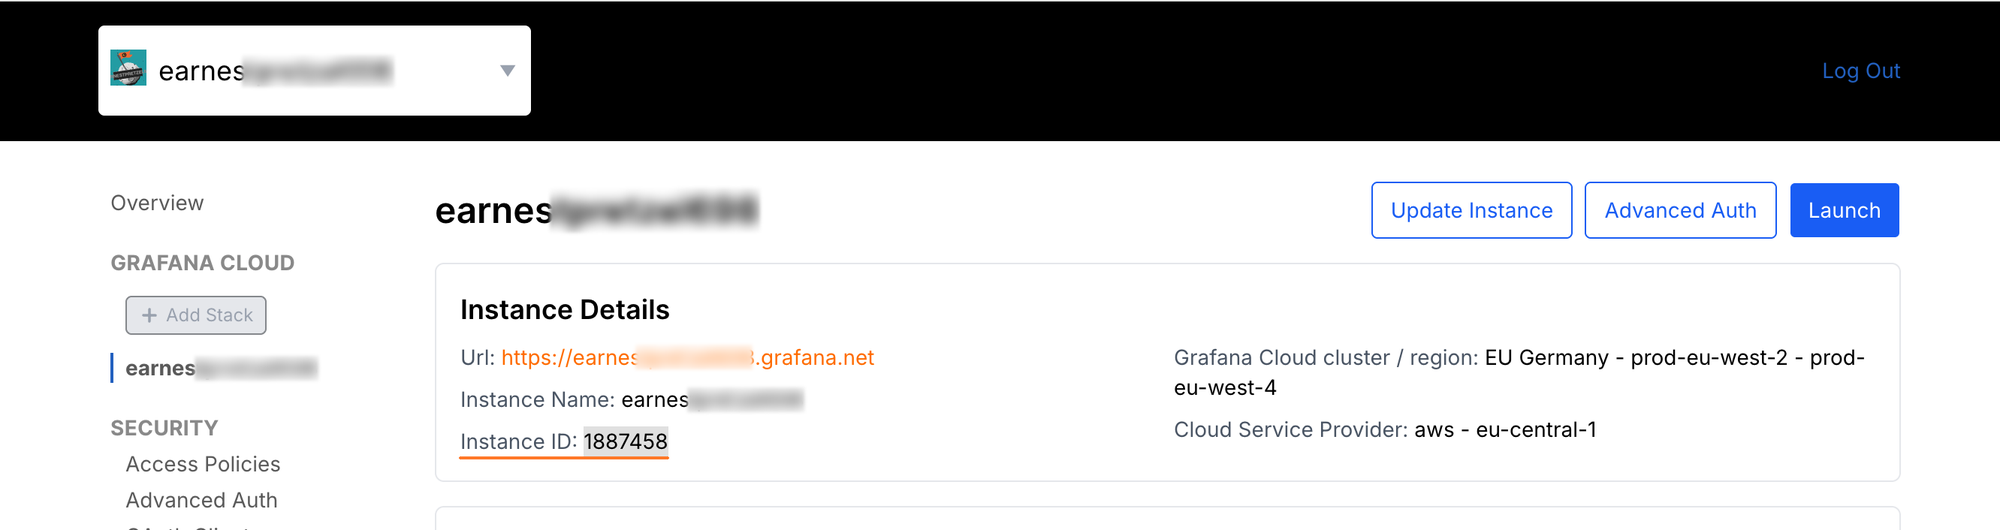
You can also find the instance ID in the Grafana Cloud Portal. Open your stack and click Details on the Grafana tile.
Create the connection
-
In Scalr, go to the account scope, open Integrations, select Grafana, and choose Grafana.com as the hosting.
-
Enter a name, the OTLP endpoint, the instance ID, and the token. Use the base OTLP URL, without
/v1/logs.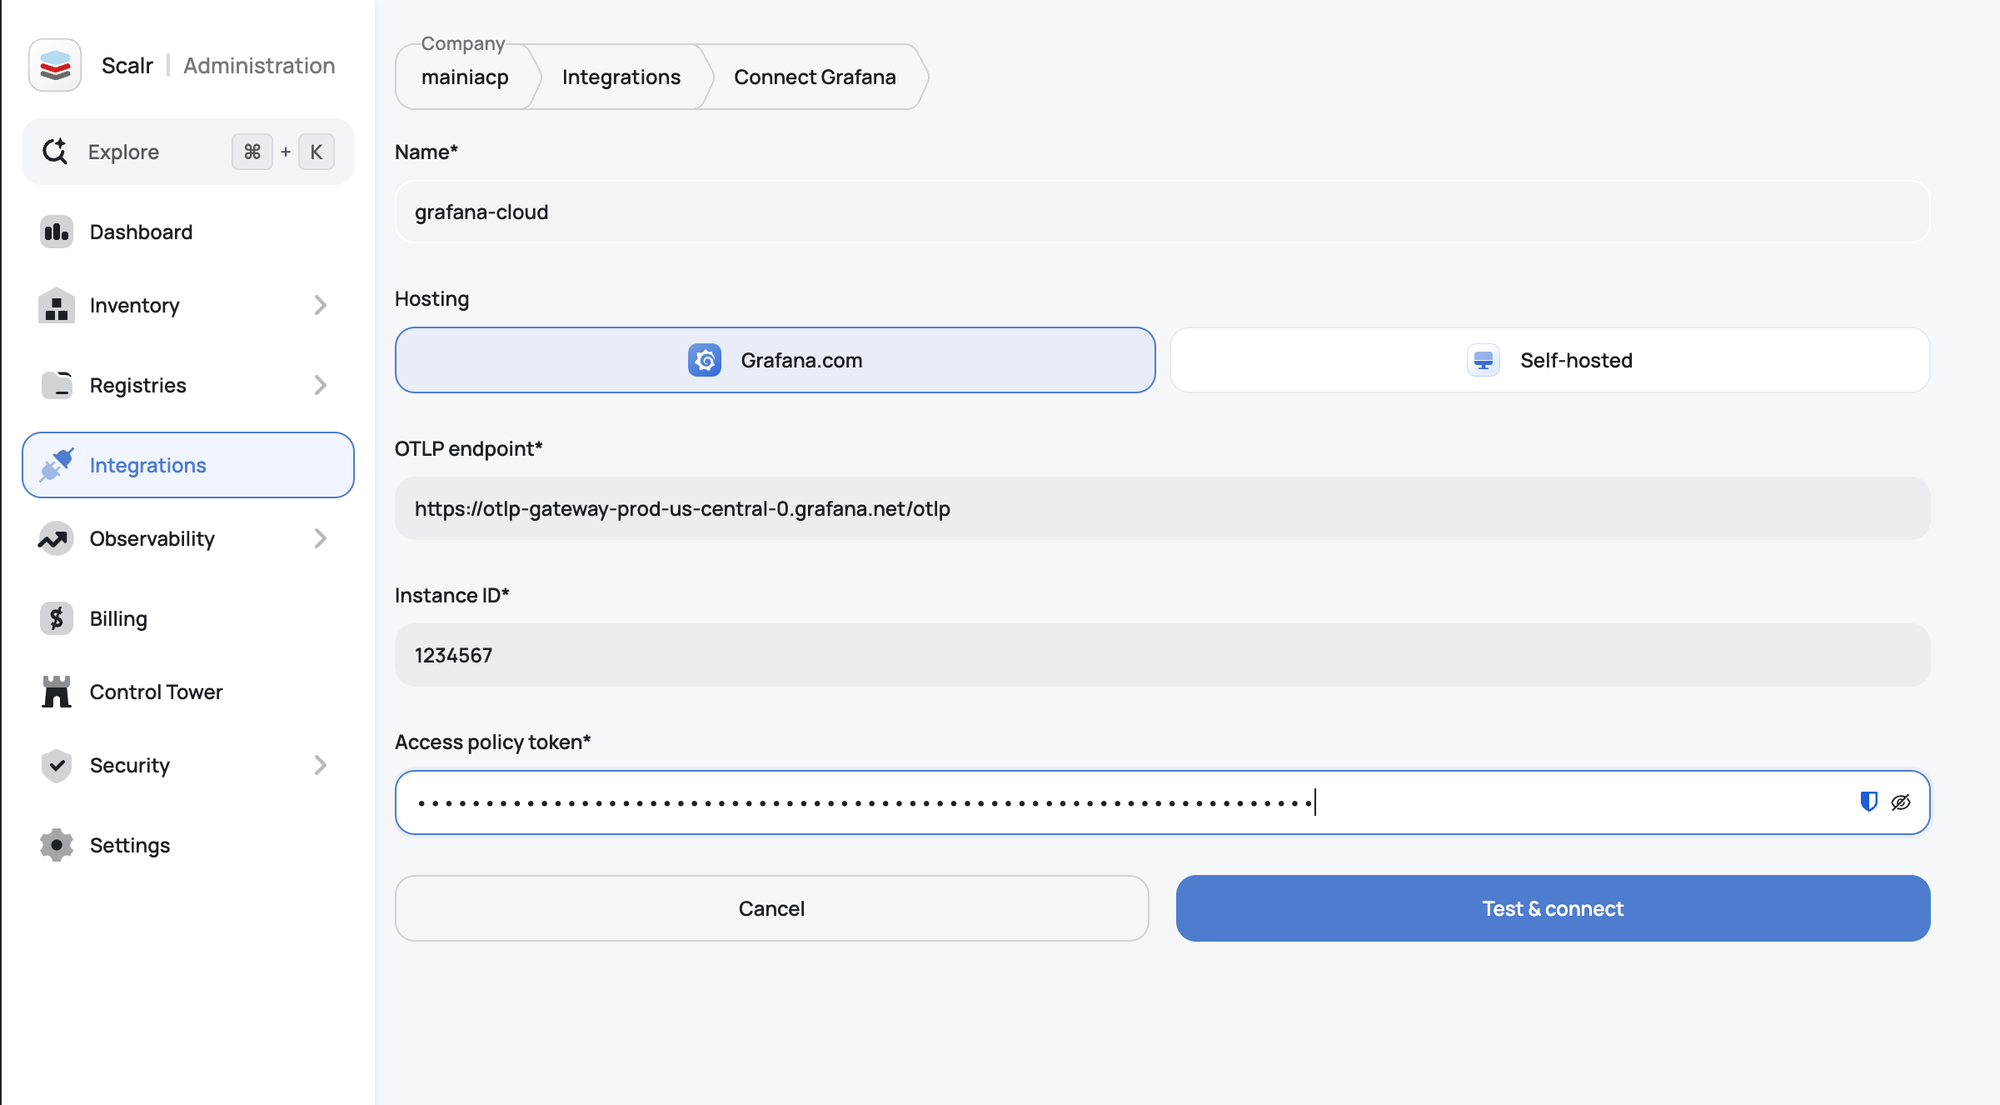
-
Click Test & connect. Scalr sends one test record with the message
Scalr connection testand creates the connection if Grafana Cloud accepts it.
Connect a self-hosted Loki
- In Scalr, go to the account scope, open Integrations, select Grafana, and choose Self-hosted as the hosting.
- Enter a name and the Loki OTLP endpoint, for example
https://loki.example.com:3100/otlp. - Select the authentication type that matches what is in front of your Loki:
- Basic - a username and password for the proxy in front of Loki.
- Bearer token - a token for the proxy in front of Loki.
- If your Loki runs in multi-tenant mode, enter the Tenant ID. Scalr sends it in the
X-Scope-OrgIDheader. - Click Test & connect. Scalr sends one test record with the message
Scalr connection testand creates the connection if Loki accepts it.
Events
All records arrive in the service_name="scalr" stream. The scalr_event_name field identifies the event.
Run events are sent to every active Grafana connection in the account without additional configuration.
| Event | scalr_event_name | Sent when |
|---|---|---|
| Run executed | RunExecuted | A run finishes |
| Run waiting for a policy override | RunPolicyOverrideNeeded | A run stops at a soft-mandatory policy failure |
Audit logs and related events are sent only to the connection selected as the audit log destination. See Audit logs.
| Event | scalr_event_name | Sent when |
|---|---|---|
| Audit log | AuditLog | An action is recorded in the audit log, such as a workspace change or a user sign-in |
| Audit log disabled | AuditLogDisabled | Audit log streaming is disabled or switched to a different destination |
| Account deleted | AccountDeleted | The account is deleted |
The record body is the event in JSON. The log level follows the event: INFO for successful runs and audit logs, WARN for runs waiting for a policy override and for alerts, and ERROR for failed runs.
Run executed
event_type is the severity of the run: success, info, warning, or error. To identify the kind of event, use scalr_event_name.
{
  "title": "Scalr run execution completed on workspace 'workspace-name' (environment-name). Run ID: run-1234567890.",
  "event": {
    "run-id": "run-1234567890",
    "source": "vcs",
    "is-dry": false,
    "is-destroy": false,
    "is-agent": false,
    "is-postponed": false,
    "result": "applied",
    "error-code": null,
    "message": "Update network settings",
    "duration": 137000000000.0,
    "account": "account-name",
    "workspace": "workspace-name",
    "environment": "environment-name",
    "workspace-type": "unmapped",
    "user-email": "[email protected]",
    "planned-changes": {"additions": 1, "changes": 0, "destructions": 0},
    "applied-changes": {"additions": 1, "changes": 0, "destructions": 0},
    "policy-failures": [],
    "policy-failures-count": 0,
    "run-url": "https://my_acc.scalr.io/v2/e/env-1234567890/workspaces/ws-1234567890/runs/run-1234567890",
    "connection-name": "connection-name"
  },
  "event_type": "success"
}
Audit log
{
  "target": {
    "id": "ws-1234567890",
    "type": "workspaces",
    "display-name": "workspace-name",
    "context": {
      "account": {"id": "acc-1234567890", "display-name": "account-name"},
      "environment": {"id": "env-1234567890", "display-name": "environment-name"},
      "workspace": {"id": "ws-1234567890", "display-name": "workspace-name"}
    }
  },
  "timestamp": "2026-11-04T18:50:53.700485+00:00",
  "request": {
    "id": "63ddd008eced0487812b1005f06ddff4",
    "ip-address": "203.0.113.10",
    "xff-ips": ["203.0.113.10"],
    "source": "ui",
    "user-agent": "Mozilla/5.0",
    "client": null,
    "action": "create-workspace"
  },
  "outcome": {"result": "SUCCESS", "status-code": 201},
  "actor": {
    "id": "user-1234567890",
    "email": "[email protected]",
    "type": "user",
    "access-token": {"id": null, "type": "session", "token": "...UlzZ-c", "origin": "static"},
    "impersonated-by": null
  }
}
Audit log disabled
{
  "title": "Audit Log Disabled.",
  "timestamp": "2026-11-04T18:50:53.700485+00:00",
  "user-id": 111,
  "user-email": "[email protected]",
  "disabled-integration": {
    "id": "in-1234567890",
    "name": "connection-name",
    "type": "Grafana"
  }
}
Fields and search
Scalr sends two fields as structured metadata, outside the record body:
| Field | Present on |
|---|---|
scalr_event_name | All records |
scalr_tags | Run events, audit logs |
To filter on other fields, use | json. Nested keys are joined with _, and - becomes _, for example target_context_account_display_name.
scalr_tags holds all tags as one string, so match them with a regex.
Open Explore in Grafana, select your Loki data source, and switch the query editor to Code.
{service_name="scalr"} | scalr_event_name="RunExecuted" | json | event_result="errored"{service_name="scalr"} | scalr_event_name="AuditLog" | json | request_action="create-workspace"{service_name="scalr"} | scalr_event_name="AuditLog" | json | actor_email="{email}"{service_name="scalr"} | scalr_tags=~".*scalr-workspace-name:{name}.*"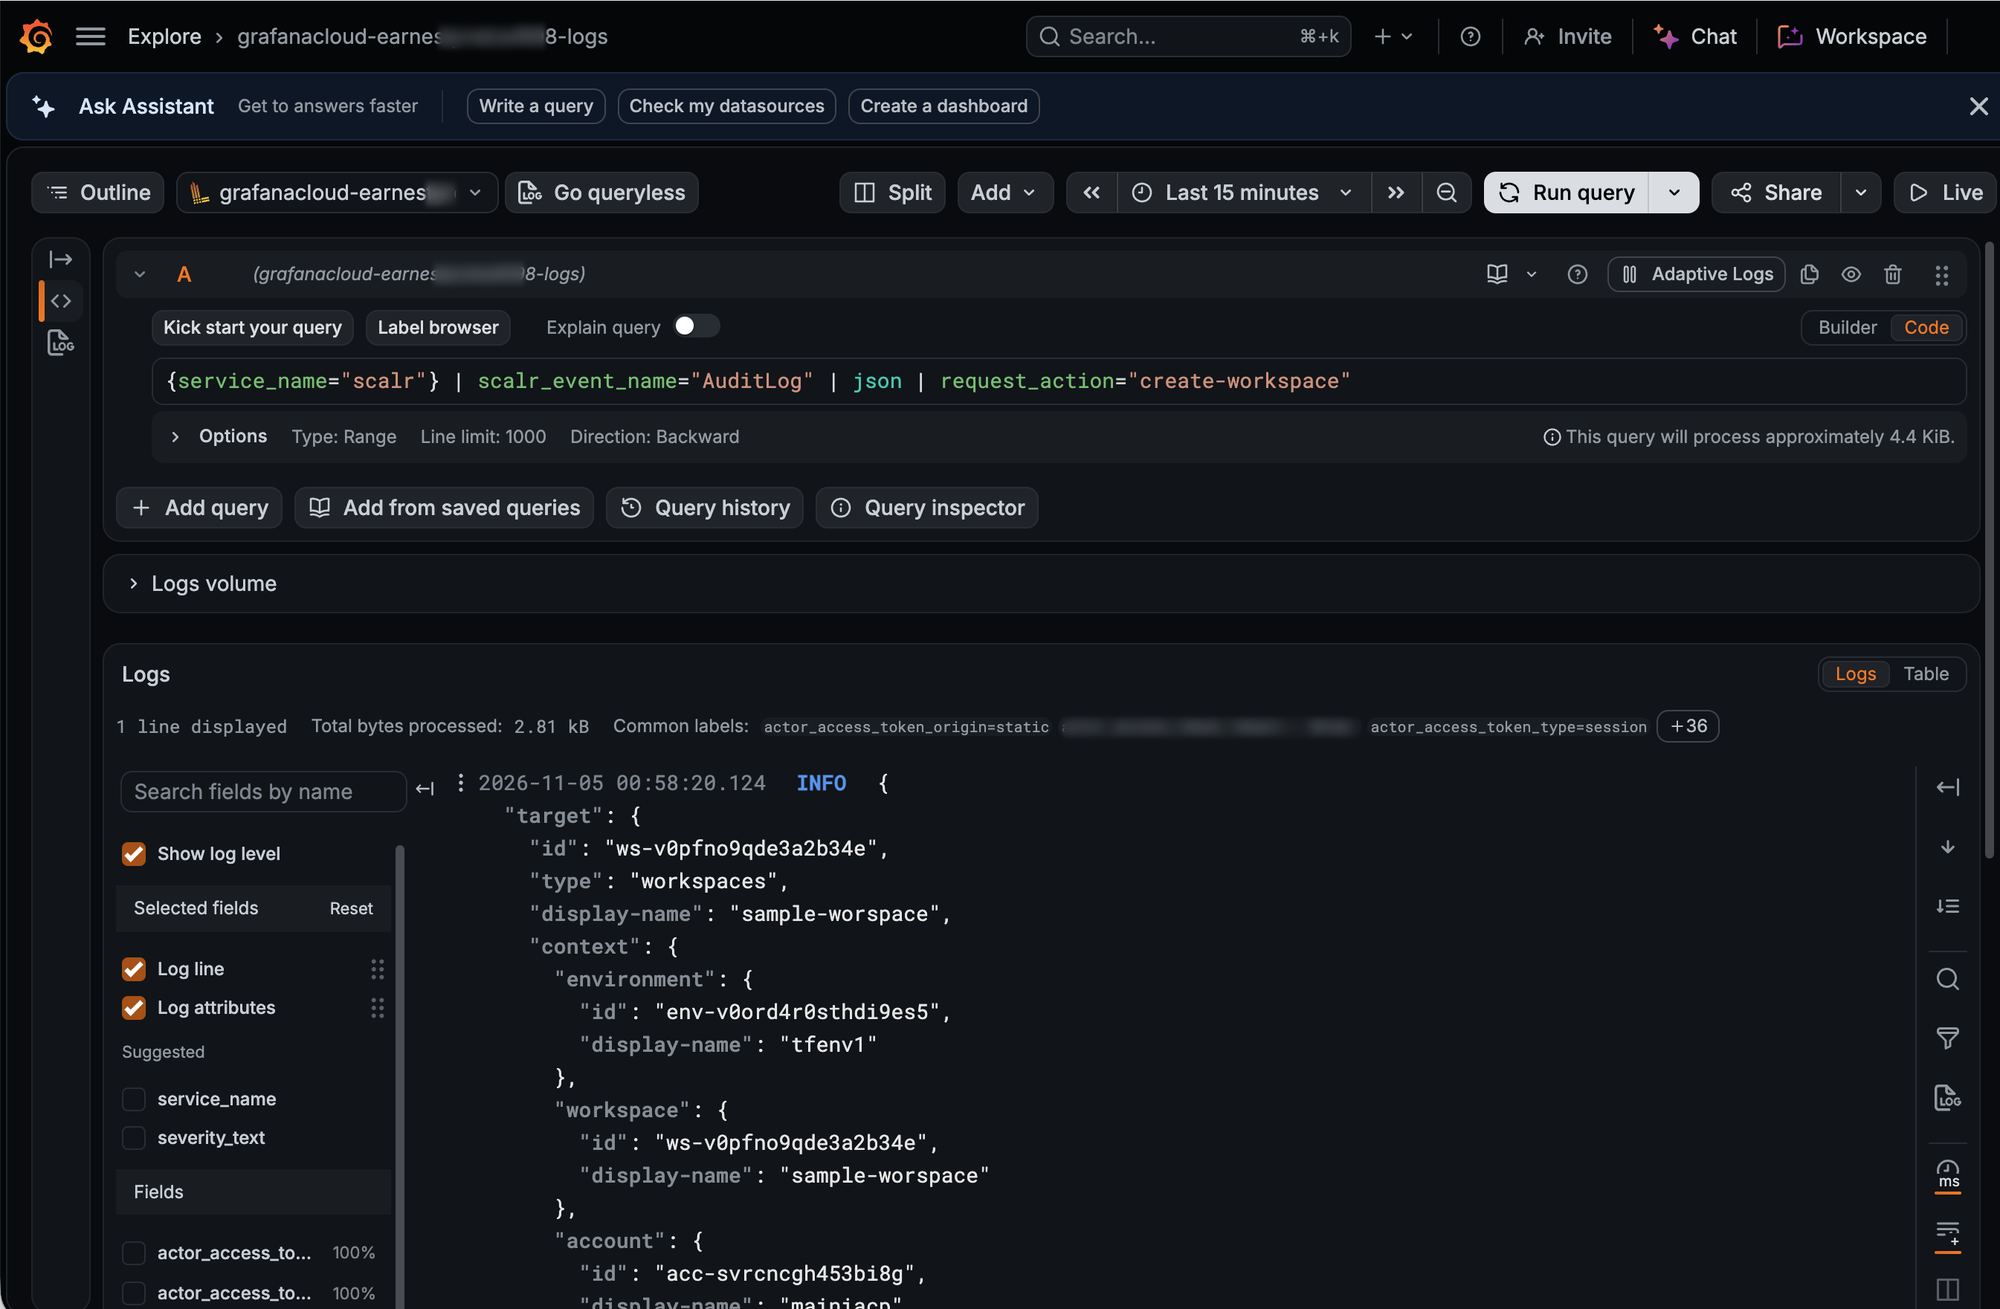
Audit logs
See Audit Logs for what audit logs record and the other destinations.
To stream audit logs to Grafana, go to Settings at the account scope, open Security, then Audit logs. Enable streaming, select Grafana as the destination, and select the connection.
When you disable audit log streaming or switch it to a different destination, Scalr sends an AuditLogDisabled record to the previous connection.
Updated about 2 hours ago