

Splunk
The Splunk integration streams Scalr run events and audit logs to a Splunk HTTP Event Collector (HEC), so you can search them, build dashboards, and create alerts in Splunk Cloud Platform or Splunk Enterprise.
Prerequisites
- Splunk Cloud Platform or Splunk Enterprise with HTTP Event Collector enabled.
- The HEC endpoint must use HTTPS with a publicly trusted certificate and be reachable from the public internet.
- A HEC token with indexer acknowledgment turned off.
- A Scalr user with permission to manage integrations at the account scope.
Create a HEC token
-
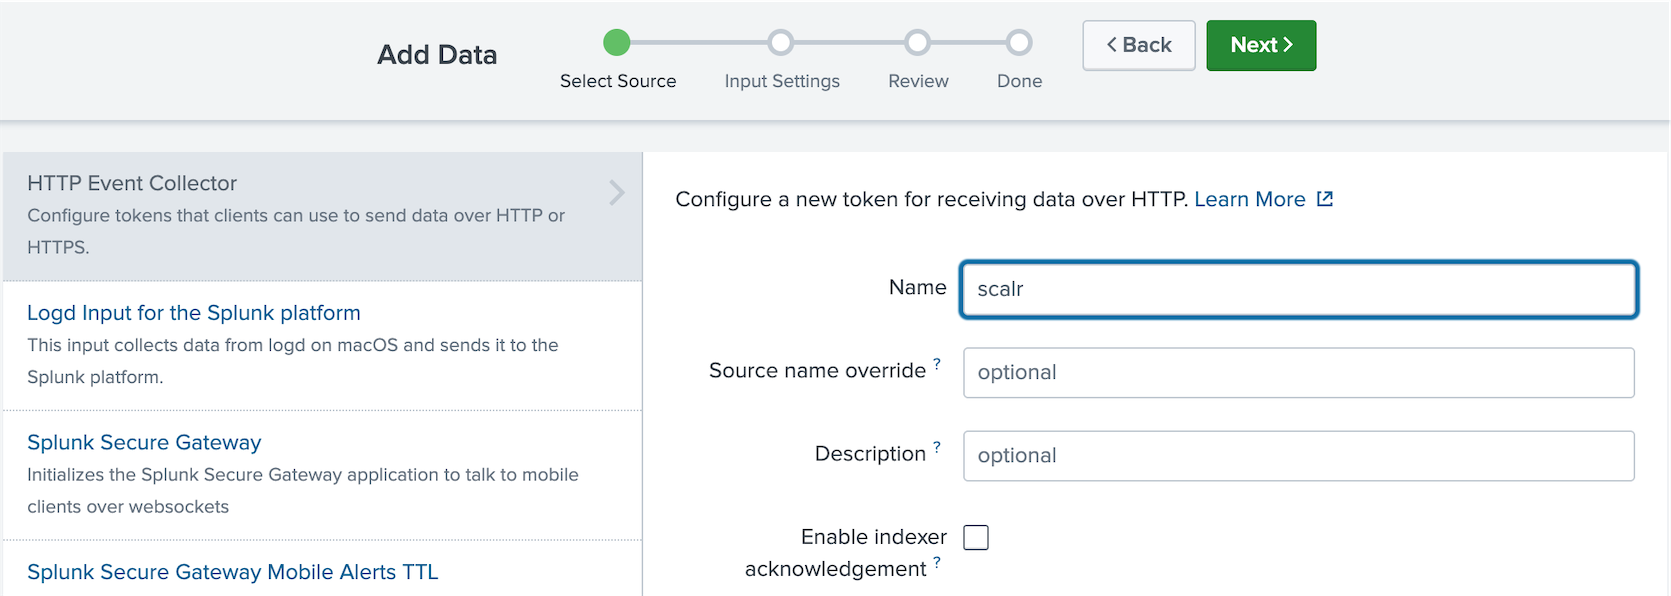
In Splunk Web, go to Manage > Settings > Data inputs > HTTP Event Collector, and click New Token.
-
Enter a Name. Leave Enable indexer acknowledgment turned off, and click Next.
-
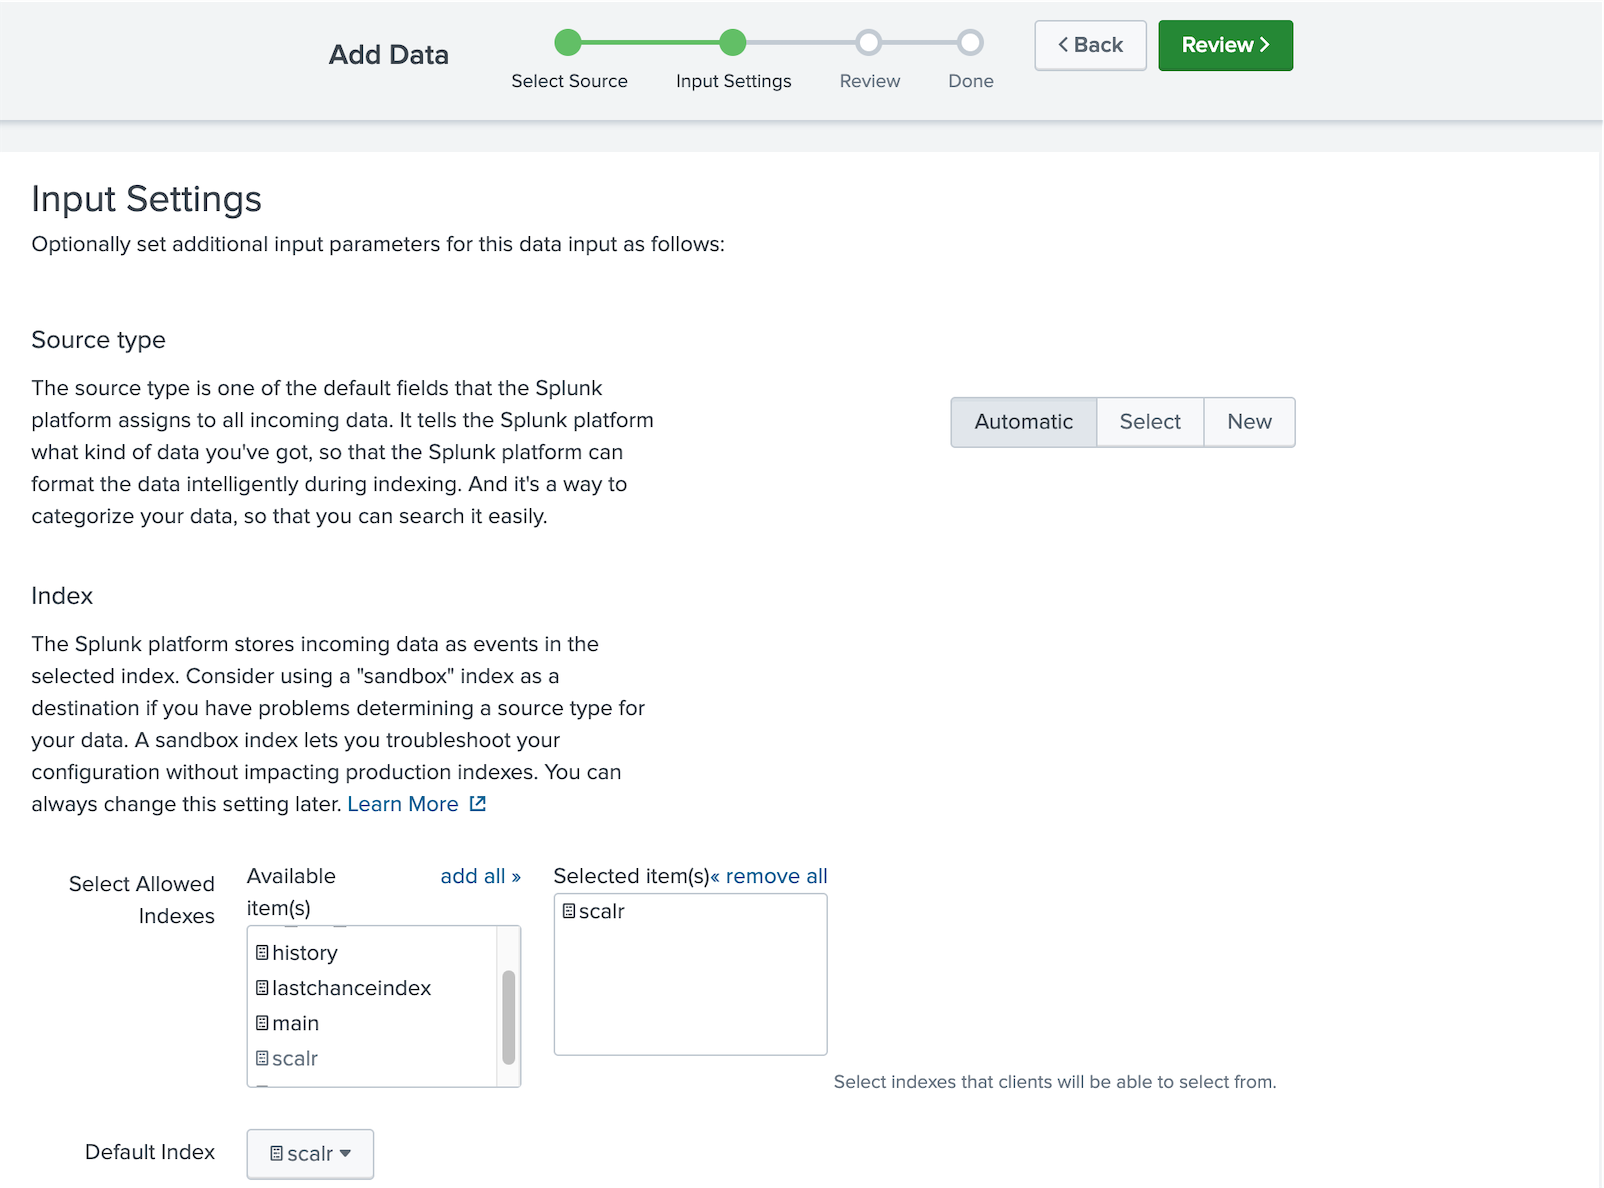
Under Allowed Indexes, select the indexes Scalr can write to, and select the Default Index. Click Review, then Submit.
-
Copy the Token Value.
Use Allowed Indexes. With a list, Splunk rejects any other index, and Scalr shows the error when you connect. Without a list, Splunk accepts any index name, so Scalr cannot detect a mistyped one. Events for an index that does not exist go to the last chance index if one is configured, such as lastchanceindex on Splunk Cloud Platform. Otherwise, Splunk drops them.
Create the connection
-
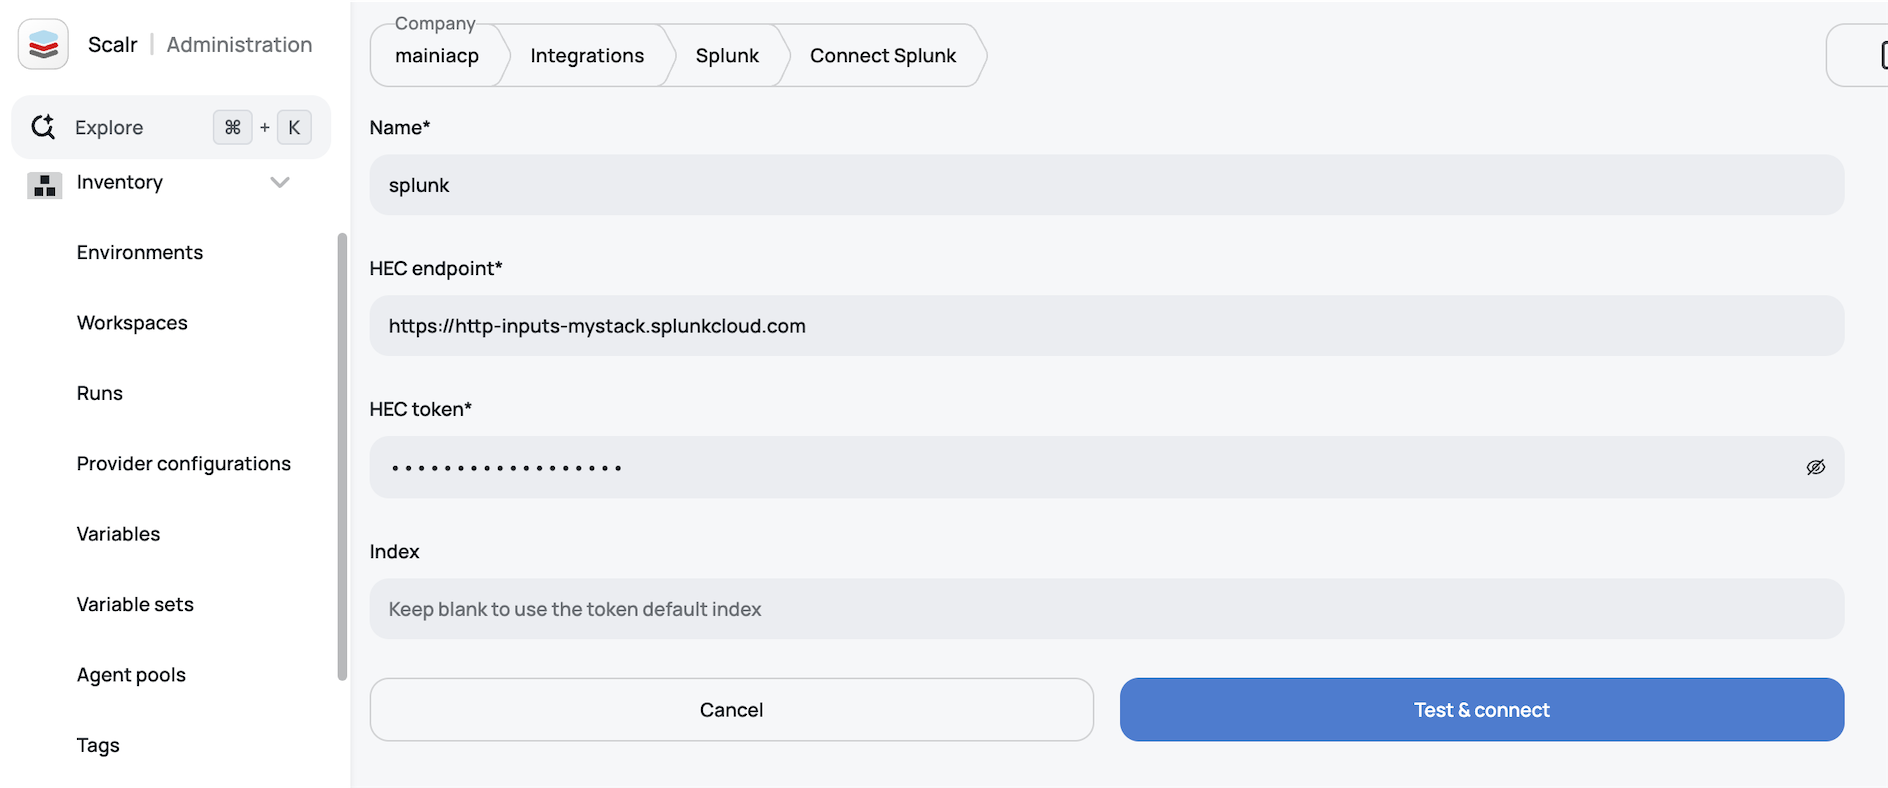
In Scalr, go to the account scope, open Integrations, and select Splunk.
-
Enter a name and the base HEC URL as the HEC endpoint, without
/services/collector. For example,https://http-inputs-{stack}.splunkcloud.comfor Splunk Cloud Platform, orhttps://splunk.example.com:8088for Splunk Enterprise. -
Enter the HEC token.
-
Optionally, enter the Index. If you leave it blank, events go to the default index of the token.
-
Click Test & connect. Scalr sends one test event with the message
Scalr connection testand creates the connection if Splunk accepts it. The test event stays in your index.
If Splunk rejects the test event, Scalr does not create the connection and shows the reason, for example, a wrong or disabled token, an index the token cannot write to, or an endpoint Scalr cannot reach.
If Splunk later rejects the token, the index, or the acknowledgment settings, Scalr sets the connection to the failed status and stops sending events to it. Events are not queued while the connection is failed. After you fix the problem in Splunk, open the connection in Scalr and click Save changes. Scalr checks the connection again and sets it back to active.
Events
All events have source=scalr, sourcetype=_json, and the account domain as host. The indexed field scalr.event.name identifies the event.
Run events are sent to every active Splunk connection in the account without additional configuration.
| Event | scalr.event.name | Sent when |
|---|---|---|
| Run executed | RunExecuted | A run finishes |
| Run waiting for a policy override | RunPolicyOverrideNeeded | A run stops at a soft-mandatory policy failure |
Audit logs and related events are sent only to the connection selected as the audit log destination. See Audit logs.
| Event | scalr.event.name | Sent when |
|---|---|---|
| Audit log | AuditLog | An action is recorded in the audit log, such as a workspace change or a user sign-in |
| Audit log disabled | AuditLogDisabled | Audit log streaming is disabled or switched to a different destination |
| Account deleted | AccountDeleted | The account is deleted |
The event body is the Scalr event in JSON.
Run executed
event_type is the severity of the run: success, info, warning, or error. To identify the kind of event, use scalr.event.name.
{
  "title": "Scalr run execution completed on workspace 'workspace-name' (environment-name). Run ID: run-1234567890.",
  "event": {
    "run-id": "run-1234567890",
    "source": "vcs",
    "is-dry": false,
    "is-destroy": false,
    "is-agent": false,
    "is-postponed": false,
    "result": "applied",
    "error-code": null,
    "message": "Update network settings",
    "duration": 137000000000.0,
    "account": "account-name",
    "workspace": "workspace-name",
    "environment": "environment-name",
    "workspace-type": "unmapped",
    "user-email": "[email protected]",
    "planned-changes": {"additions": 1, "changes": 0, "destructions": 0},
    "applied-changes": {"additions": 1, "changes": 0, "destructions": 0},
    "policy-failures": [],
    "policy-failures-count": 0,
    "run-url": "https://my_acc.scalr.io/v2/e/env-1234567890/workspaces/ws-1234567890/runs/run-1234567890",
    "connection-name": "connection-name"
  },
  "tags": [
    "scalr-environment:env-1234567890",
    "scalr-workspace:ws-1234567890",
    "scalr-environment-name:environment-name",
    "scalr-workspace-name:workspace-name",
    "scalr-policy-failures-count:0"
  ],
  "event_type": "success"
}
Audit log
{
  "target": {
    "id": "ws-1234567890",
    "type": "workspaces",
    "display-name": "workspace-name",
    "context": {
      "account": {"id": "acc-1234567890", "display-name": "account-name"},
      "environment": {"id": "env-1234567890", "display-name": "environment-name"},
      "workspace": {"id": "ws-1234567890", "display-name": "workspace-name"}
    }
  },
  "timestamp": "2026-11-04T18:50:53.700485+00:00",
  "request": {
    "id": "63ddd008eced0487812b1005f06ddff4",
    "ip-address": "203.0.113.10",
    "xff-ips": ["203.0.113.10"],
    "source": "ui",
    "user-agent": "Mozilla/5.0",
    "client": null,
    "action": "create-workspace"
  },
  "outcome": {"result": "SUCCESS", "status-code": 201},
  "actor": {
    "id": "user-1234567890",
    "email": "[email protected]",
    "type": "user",
    "access-token": {"id": null, "type": "session", "token": "...UlzZ-c", "origin": "static"},
    "impersonated-by": null
  },
  "tags": [
    "scalr-action:create-workspace",
    "scalr-user-email:[email protected]",
    "scalr-environment:env-1234567890",
    "scalr-environment-name:environment-name",
    "scalr-workspace:ws-1234567890",
    "scalr-workspace-name:workspace-name"
  ]
}
Audit log disabled
{
  "title": "Audit Log Disabled.",
  "timestamp": "2026-11-04T18:50:53.700485+00:00",
  "user-id": 111,
  "user-email": "[email protected]",
  "disabled-integration": {
    "id": "in-1234567890",
    "name": "connection-name",
    "type": "Splunk"
  }
}
Fields and search
scalr.event.name is an indexed field, so it is not in the raw event. Splunk lists it with the other fields of the event. All other fields come from the JSON body and are extracted at search time, with nested keys joined by ., for example request.action.
Run events and audit logs have a tags array, which Splunk shows as tags{}. It holds Scalr values such as scalr-workspace-name:{name}, and the tags you set on the workspace and environment.
Run these searches in Search & Reporting. Add your index and a time range.
source=scalr scalr.event.name=RunExecuted "event.result"=erroredsource=scalr scalr.event.name=AuditLog "request.action"=create-workspacesource=scalr scalr.event.name=AuditLog "actor.email"="{email}"source=scalr "tags{}"="scalr-workspace-name:{name}"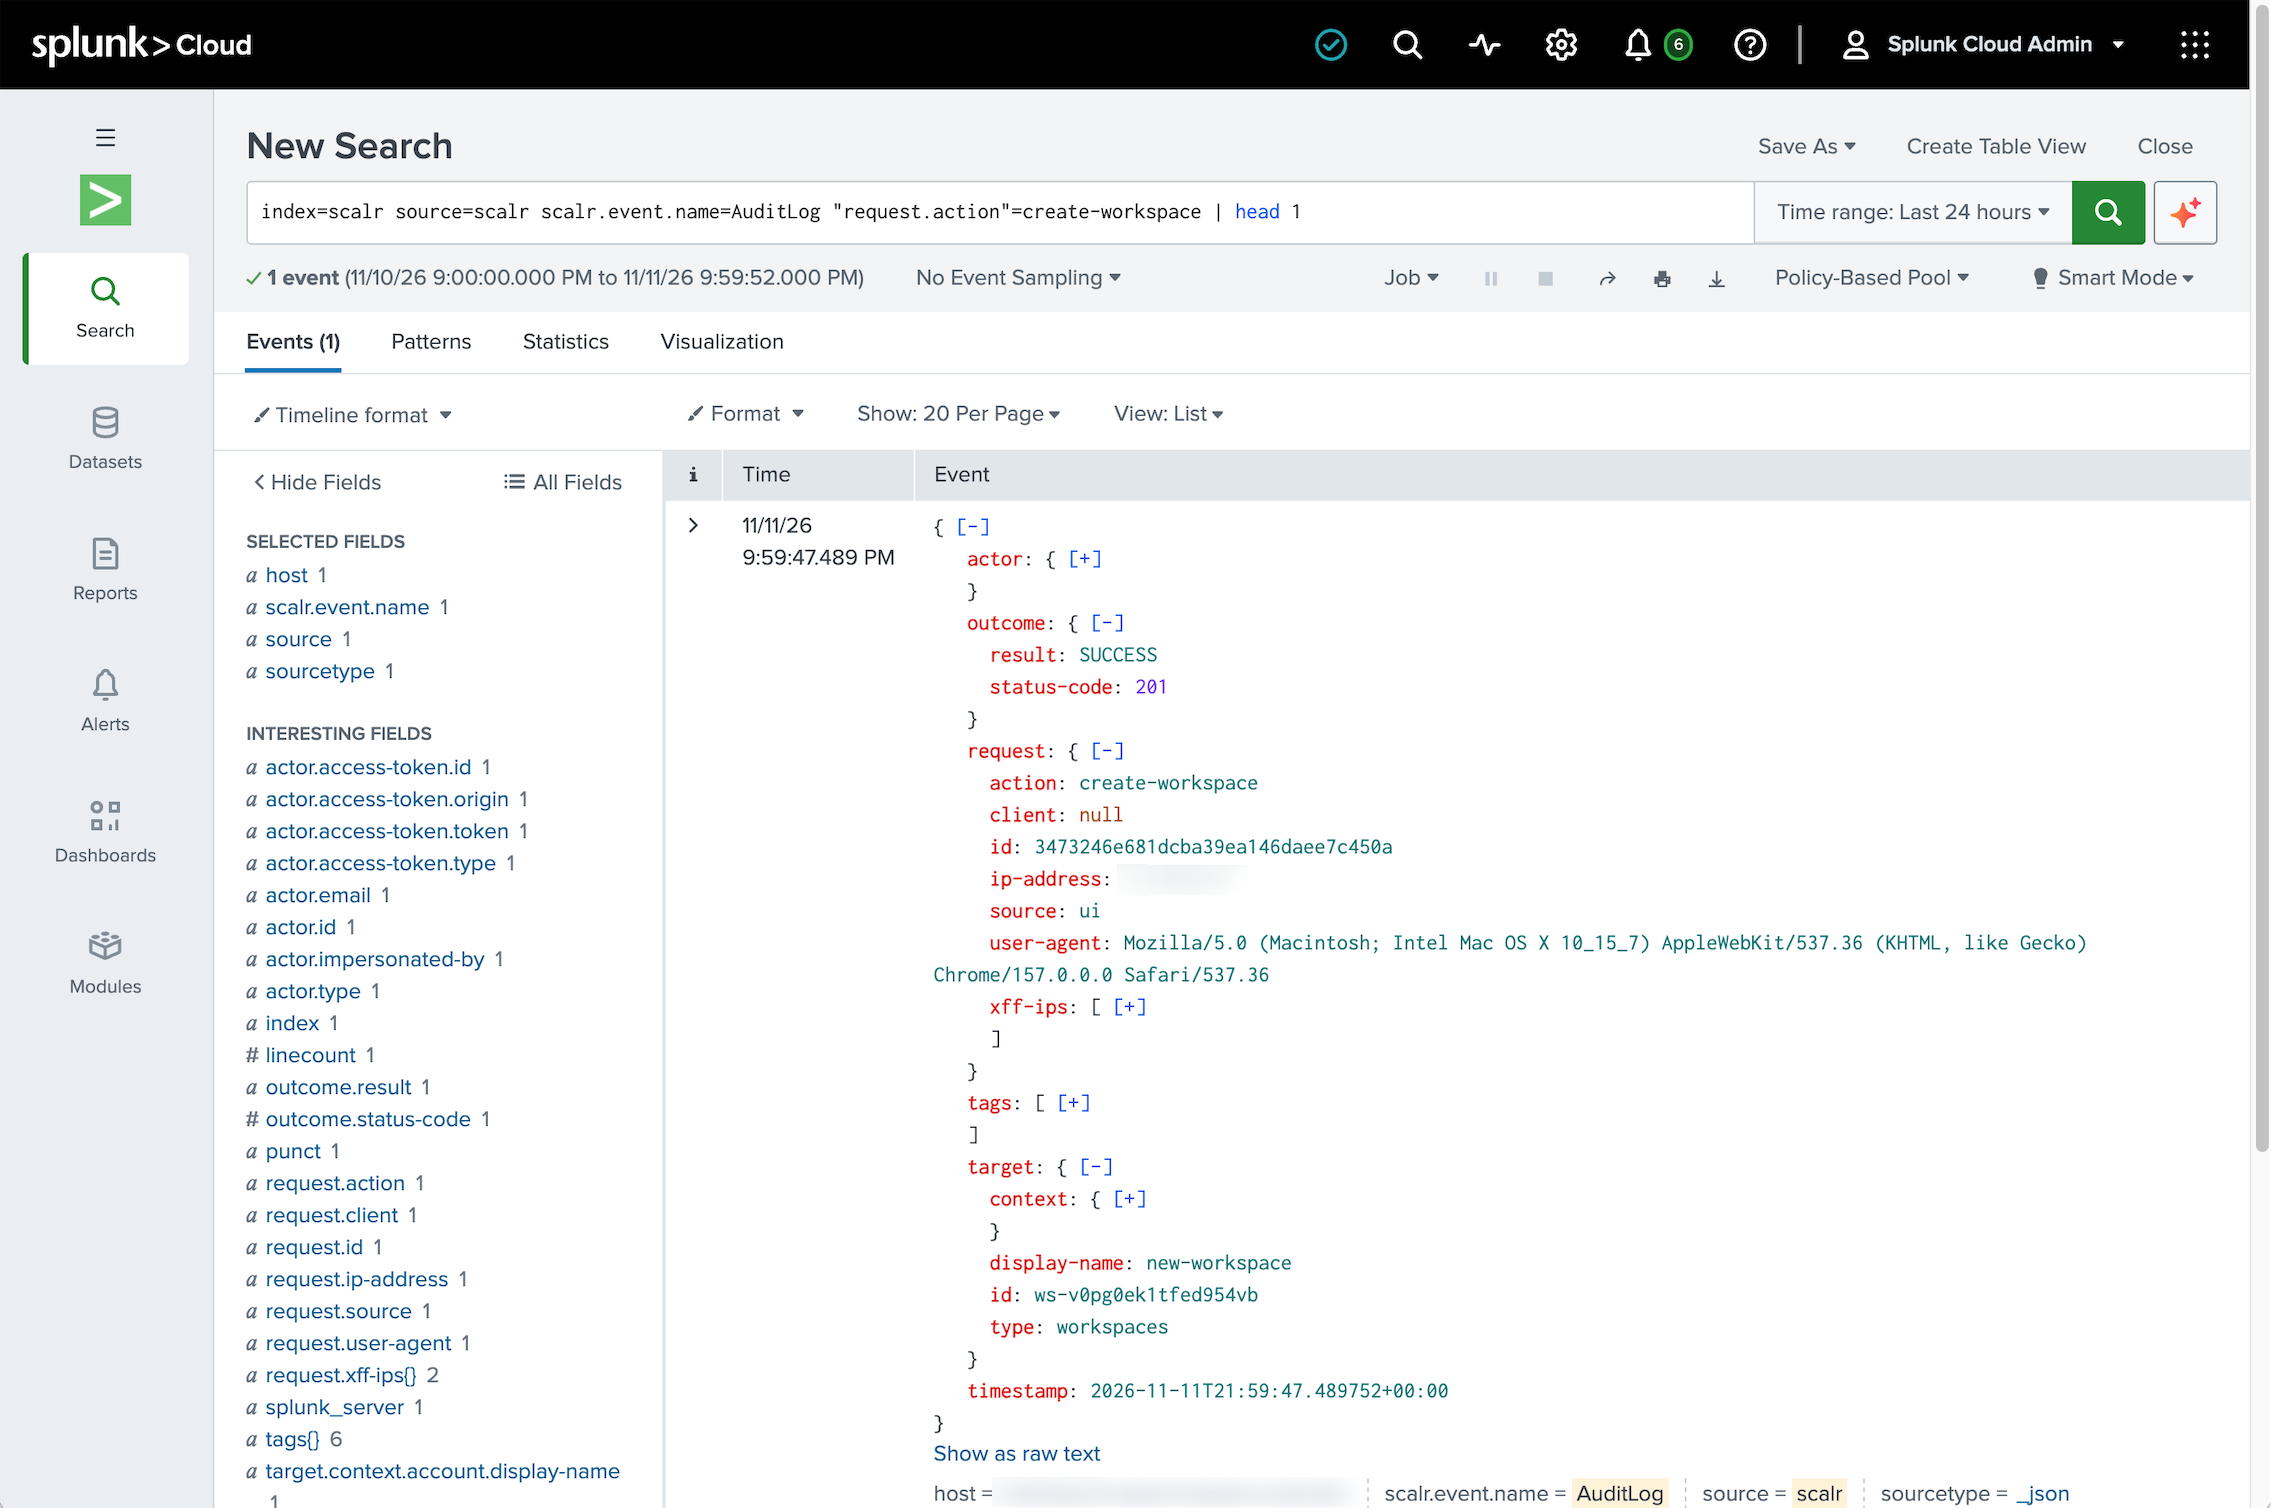
Audit logs
Note: Audit logs are an enterprise plan feature.
See Audit Logs for what audit logs record and the other destinations.
To stream audit logs to Splunk, go to Settings at the account scope, open Security, then Audit logs. Enable streaming, select Splunk as the destination, and select the connection.
When you disable audit log streaming or switch it to a different destination, Scalr sends an AuditLogDisabled event to the previous connection.
Updated about 9 hours ago